-
×
 Live in London (5 DVD) with Martin Pring
1 × $6.00
Live in London (5 DVD) with Martin Pring
1 × $6.00 -
×
 Investing In KLSE Stocks and Futures With Japanese Candlestick with Fred Tam
1 × $6.00
Investing In KLSE Stocks and Futures With Japanese Candlestick with Fred Tam
1 × $6.00 -
×
 Acclimation Course with Base Camp Trading
1 × $10.00
Acclimation Course with Base Camp Trading
1 × $10.00 -
×
 Complete Day Trading Course with The Trading Floor
1 × $13.00
Complete Day Trading Course with The Trading Floor
1 × $13.00 -
×
 Simple Forex Profits with Rayy Bannzz
1 × $31.00
Simple Forex Profits with Rayy Bannzz
1 × $31.00 -
×
 Algo Trading Strategies 2017 with Autotrading Academy
1 × $6.00
Algo Trading Strategies 2017 with Autotrading Academy
1 × $6.00 -
×
 The Internet Trading Course with Alpesh Patel
1 × $6.00
The Internet Trading Course with Alpesh Patel
1 × $6.00 -
×
 4D Bootcamp with Black Rabbit
1 × $10.00
4D Bootcamp with Black Rabbit
1 × $10.00 -
×
 Options Trading. The Hidden Reality Course with Charles Cottle
1 × $6.00
Options Trading. The Hidden Reality Course with Charles Cottle
1 × $6.00 -
×
 The Trading Masterclass with Chris Capre
1 × $23.00
The Trading Masterclass with Chris Capre
1 × $23.00 -
×
 Timing the Market with Unique Indicators with Sherman McCellan
1 × $6.00
Timing the Market with Unique Indicators with Sherman McCellan
1 × $6.00 -
×
 Fixed Income Securities (2nd Ed.) with Bruce Tuckman
1 × $10.00
Fixed Income Securities (2nd Ed.) with Bruce Tuckman
1 × $10.00 -
×
 Traders Winning Edge with Adrienne Laris Toghraie
1 × $6.00
Traders Winning Edge with Adrienne Laris Toghraie
1 × $6.00 -
×
 Getting Started in Stocks with Alvin D.Hall
1 × $6.00
Getting Started in Stocks with Alvin D.Hall
1 × $6.00 -
×
 Essentials in Quantitative Trading QT01 By HangukQuant's
1 × $23.00
Essentials in Quantitative Trading QT01 By HangukQuant's
1 × $23.00 -
×
 Mastering Collar Trades Pro with Vince Vora - TradingWins
1 × $6.00
Mastering Collar Trades Pro with Vince Vora - TradingWins
1 × $6.00 -
×
 Principles of Artificial Neural Networks (2nd Ed.) with Daniel Graupe
1 × $6.00
Principles of Artificial Neural Networks (2nd Ed.) with Daniel Graupe
1 × $6.00 -
×
 CBOT Seminar on Market Profile (101 & 102) with Alex Benjamin
1 × $6.00
CBOT Seminar on Market Profile (101 & 102) with Alex Benjamin
1 × $6.00 -
×
 Staying Alive in the Markets (Video & Manual) with Mark Cook
1 × $6.00
Staying Alive in the Markets (Video & Manual) with Mark Cook
1 × $6.00 -
×
 IBD Home Study Course Package with Investor's Business Daily
1 × $17.00
IBD Home Study Course Package with Investor's Business Daily
1 × $17.00 -
×
 ICT Mentorship – 2019
1 × $13.00
ICT Mentorship – 2019
1 × $13.00 -
×
 Options Trading & Ultimate MasterClass With Tyrone Abela - FX Evolution
1 × $54.00
Options Trading & Ultimate MasterClass With Tyrone Abela - FX Evolution
1 × $54.00 -
×
 Supply And Demand Zone Trading Course with Trading180
1 × $5.00
Supply And Demand Zone Trading Course with Trading180
1 × $5.00 -
×
 Elite Gap Trading with Nick Santiago - InTheMoneyStocks
1 × $93.00
Elite Gap Trading with Nick Santiago - InTheMoneyStocks
1 × $93.00 -
×
 Setups of a Winning Trader with Gareth Soloway
1 × $521.00
Setups of a Winning Trader with Gareth Soloway
1 × $521.00 -
×
 Options Bootcamp with Sid Woolfolk
1 × $6.00
Options Bootcamp with Sid Woolfolk
1 × $6.00 -
×
 PRO COURSE Order Flow Strategy with Gova Trading Academy
1 × $5.00
PRO COURSE Order Flow Strategy with Gova Trading Academy
1 × $5.00 -
×
 How I Trade Growth Stocks In Bull And Bear Markets
1 × $54.00
How I Trade Growth Stocks In Bull And Bear Markets
1 × $54.00 -
×
 Quality FX Academy
1 × $5.00
Quality FX Academy
1 × $5.00 -
×
 Fundamentals Trading
1 × $6.00
Fundamentals Trading
1 × $6.00 -
×
 Proven Chart Patterns: Key Indicators for Success in Today’s Markets with Chris Manning
1 × $6.00
Proven Chart Patterns: Key Indicators for Success in Today’s Markets with Chris Manning
1 × $6.00 -
×
 Get to know the VIX Index (aka The Fear Index)
1 × $15.00
Get to know the VIX Index (aka The Fear Index)
1 × $15.00 -
×
 Futures 101: An Introduction to Futures Contracts Class with Don Kaufman
1 × $6.00
Futures 101: An Introduction to Futures Contracts Class with Don Kaufman
1 × $6.00 -
×
 Trading Natural Resources in a Volatile Market with Kevin Kerr
1 × $6.00
Trading Natural Resources in a Volatile Market with Kevin Kerr
1 × $6.00 -
×
 Original Curriculum with Home Options Trading Course
1 × $6.00
Original Curriculum with Home Options Trading Course
1 × $6.00 -
×
 PFAZoneSuite [Trading Indicator] 2017
1 × $109.00
PFAZoneSuite [Trading Indicator] 2017
1 × $109.00 -
×
 Investment Illusions with Martin S.Fridson
1 × $6.00
Investment Illusions with Martin S.Fridson
1 × $6.00 -
×
 Elliott Wave Indicator Suite for ThinkorSwim
1 × $15.00
Elliott Wave Indicator Suite for ThinkorSwim
1 × $15.00 -
×
 The Handbook of Chaos Control with H.G.Schuster
1 × $6.00
The Handbook of Chaos Control with H.G.Schuster
1 × $6.00 -
×
 Matrix Spread Options Trading Course with Base Camp Trading
1 × $31.00
Matrix Spread Options Trading Course with Base Camp Trading
1 × $31.00 -
×
 Capital with Charles D.Ellis
1 × $6.00
Capital with Charles D.Ellis
1 × $6.00 -
×
 Contrarian Investment Strategies: The Next Generation with David Dreman
1 × $4.00
Contrarian Investment Strategies: The Next Generation with David Dreman
1 × $4.00 -
×
 Trading Options Effectively with Paul Forchione
1 × $4.00
Trading Options Effectively with Paul Forchione
1 × $4.00 -
×
 Advances in International Investments: Traditional and Alternative Approaches with Hung-Gay Fung, Xiaoqing Eleanor Xu & Jot Yau
1 × $6.00
Advances in International Investments: Traditional and Alternative Approaches with Hung-Gay Fung, Xiaoqing Eleanor Xu & Jot Yau
1 × $6.00 -
×
 Forex and Stocks Trading Course - Set and Forget with Alfonso Moreno
1 × $6.00
Forex and Stocks Trading Course - Set and Forget with Alfonso Moreno
1 × $6.00 -
×
 Advanced Pattern Recognition with John Cameron
1 × $23.00
Advanced Pattern Recognition with John Cameron
1 × $23.00 -
×
 Steady Compounding Investing Academy Course with Steady Compounding
1 × $55.00
Steady Compounding Investing Academy Course with Steady Compounding
1 × $55.00 -
×
 Optionetics 2007 - Home Study Course, MP3
1 × $6.00
Optionetics 2007 - Home Study Course, MP3
1 × $6.00 -
×
 The Trading Blueprint with Brad Goh - The Trading Geek
1 × $5.00
The Trading Blueprint with Brad Goh - The Trading Geek
1 × $5.00 -
×
 ProfileTraders - 5 course bundle
1 × $23.00
ProfileTraders - 5 course bundle
1 × $23.00 -
×
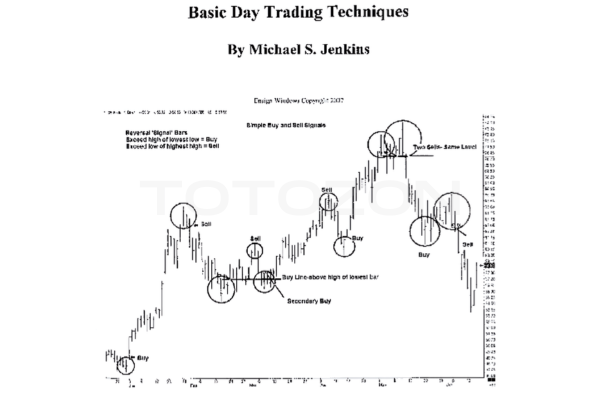 Basic Day Trading Techniques with Michael Jenkins
1 × $6.00
Basic Day Trading Techniques with Michael Jenkins
1 × $6.00 -
×
 TradeGuider Education Package
1 × $54.00
TradeGuider Education Package
1 × $54.00 -
×
 TradeCraft: Your Path to Peak Performance Trading By Adam Grimes
1 × $15.00
TradeCraft: Your Path to Peak Performance Trading By Adam Grimes
1 × $15.00

Practical Introduction to Bollinger Bands 2013
$6.00
File Size: Coming soon!
Delivery Time: 1–12 hours
Media Type: Online Course
Practical Introduction to Bollinger Bands 2013
Understanding Bollinger Bands
What Are Bollinger Bands?
Bollinger Bands are a popular technical analysis tool developed by John Bollinger in the 1980s. They consist of a middle band, which is a simple moving average, and two outer bands that are standard deviations away from the middle band. These bands help traders understand volatility and identify potential buy and sell signals.
Importance in Technical Analysis
Bollinger Bands are essential for traders because they provide a visual representation of price volatility and potential market reversals. They can be applied to various asset classes, including stocks, commodities, and currencies.
Components of Bollinger Bands
The Middle Band
The middle band is typically a 20-day simple moving average (SMA). This average smooths out price data, providing a central value around which the upper and lower bands are calculated.
The Upper and Lower Bands
The upper and lower bands are usually set two standard deviations away from the middle band. These bands expand and contract based on market volatility, offering insights into price movements.
Standard Deviation
Standard deviation measures the dispersion of data from its mean. In Bollinger Bands, it helps determine the distance between the upper and lower bands and the middle band.
Calculating Bollinger Bands
Step-by-Step Calculation
- Calculate the 20-day SMA: Add the closing prices of the past 20 days and divide by 20.
- Determine the standard deviation: Calculate the standard deviation of the same 20-day period.
- Upper Band: Middle Band + (2 * Standard Deviation)
- Lower Band: Middle Band – (2 * Standard Deviation)
Example Calculation
If the 20-day SMA is $100 and the standard deviation is $5, the upper band would be $110 ($100 + (2 * $5)) and the lower band would be $90 ($100 – (2 * $5)).
Using Bollinger Bands in Trading
Identifying Trends
Bollinger Bands can help identify the direction of a trend. When the price consistently touches the upper band, it indicates an uptrend. Conversely, touching the lower band suggests a downtrend.
Overbought and Oversold Conditions
When the price moves near the upper band, the asset might be overbought, signaling a potential sell. If the price approaches the lower band, it might be oversold, indicating a potential buy.
Breakouts and Volatility
Bollinger Bands can also signal breakouts. When the bands squeeze together, it indicates low volatility and a potential breakout. A sudden widening of the bands suggests increased volatility and potential trading opportunities.
Practical Applications
Trading Strategies
Bollinger Bounce
This strategy is based on the idea that the price will revert to the mean. When the price touches the upper band, traders might consider selling. Conversely, touching the lower band might be a buy signal.
Bollinger Squeeze
The Bollinger Squeeze strategy focuses on periods of low volatility. When the bands narrow, it suggests that a breakout is imminent. Traders can prepare to enter positions in the direction of the breakout.
Combining with Other Indicators
Bollinger Bands can be combined with other technical indicators like the Relative Strength Index (RSI) or Moving Average Convergence Divergence (MACD) to enhance trading decisions.
Advantages of Bollinger Bands
Visual Clarity
Bollinger Bands provide a clear visual representation of price volatility, making it easier for traders to identify potential buy and sell signals.
Flexibility
They can be used in various markets and on different time frames, making them versatile tools for traders of all styles.
Reliability
When used correctly, Bollinger Bands can be reliable indicators of market trends and potential reversals.
Limitations of Bollinger Bands
Not a Standalone Indicator
Bollinger Bands should not be used in isolation. They are most effective when combined with other technical analysis tools.
False Signals
Like all technical indicators, Bollinger Bands can produce false signals. Traders should use them with caution and confirm signals with additional analysis.
Tips for Using Bollinger Bands
Customize Settings
Traders can adjust the period and standard deviation settings of Bollinger Bands to suit their trading style and the specific asset being traded.
Monitor Market Conditions
Regularly review market conditions and adjust your trading strategy accordingly. Bollinger Bands are more effective in certain market environments.
Practice and Patience
Successful trading with Bollinger Bands requires practice and patience. Use a demo account to test strategies before applying them to live trading.
Conclusion
Bollinger Bands are a powerful tool for traders, offering insights into market volatility and potential trading opportunities. By understanding their components, calculations, and applications, traders can effectively incorporate Bollinger Bands into their trading strategies to improve their decision-making and profitability.
FAQs
What are Bollinger Bands used for?
Bollinger Bands are used to measure market volatility and identify potential buy and sell signals based on price movements relative to the bands.
How do you calculate Bollinger Bands?
Bollinger Bands are calculated using a 20-day simple moving average and adding/subtracting two standard deviations to create the upper and lower bands.
Can Bollinger Bands be used for day trading?
Yes, Bollinger Bands can be used for day trading, as well as swing trading and long-term investing, due to their flexibility in different time frames.
What is the Bollinger Squeeze?
The Bollinger Squeeze occurs when the bands narrow, indicating low volatility and a potential breakout. It suggests that traders should prepare for a possible significant price move.
Should Bollinger Bands be used with other indicators?
Yes, Bollinger Bands are most effective when used in conjunction with other technical indicators, such as RSI or MACD, to confirm signals and enhance trading decisions.
Be the first to review “Practical Introduction to Bollinger Bands 2013”
You must be logged in to post a review.
Related products

Forex Trading
Original price was: $239.00.$8.00Current price is: $8.00.

Original price was: $299.00.$8.00Current price is: $8.00.
Forex Trading
Original price was: $850.00.$23.00Current price is: $23.00.

Forex Trading
Original price was: $249.00.$15.00Current price is: $15.00.

Original price was: $695.00.$41.00Current price is: $41.00.

Original price was: $997.00.$13.00Current price is: $13.00.

Forex Trading
Original price was: $799.00.$15.00Current price is: $15.00.

Original price was: $139.00.$23.00Current price is: $23.00.

Forex Trading
Original price was: $397.00.$31.00Current price is: $31.00.

Original price was: $997.00.$8.00Current price is: $8.00.
Forex Trading
Original price was: $697.00.$5.00Current price is: $5.00.

Original price was: $895.00.$15.00Current price is: $15.00.

Forex Trading
The Complete Guide to Multiple Time Frame Analysis & Reading Price Action with Aiman Almansoori
Original price was: $1,399.00.$13.00Current price is: $13.00.

Forex Trading
Original price was: $550.00.$5.00Current price is: $5.00.

Original price was: $197.00.$5.00Current price is: $5.00.

Forex Trading
Original price was: $125.00.$17.00Current price is: $17.00.

Forex Trading
Original price was: $1,098.00.$39.00Current price is: $39.00.

Original price was: $1,200.00.$23.00Current price is: $23.00.

Forex Trading
Original price was: $2,000.00.$23.00Current price is: $23.00.

Forex Trading
Quantamentals – The Next Great Forefront Of Trading and Investing with Trading Markets
Original price was: $1,495.00.$8.00Current price is: $8.00.

Reviews
There are no reviews yet.