-
×
 Masterclass 5.0 with RockzFX
1 × $5.00
Masterclass 5.0 with RockzFX
1 × $5.00 -
×
 Investing in stocks: Avoid stock market loss
1 × $15.00
Investing in stocks: Avoid stock market loss
1 × $15.00 -
×
 Million Dollar Stock Market Idea with Larry Williams
1 × $6.00
Million Dollar Stock Market Idea with Larry Williams
1 × $6.00 -
×
 Hands On Training Bundle with Talkin Options
1 × $23.00
Hands On Training Bundle with Talkin Options
1 × $23.00 -
×
 How to Predict and Prepare for a Stock Market Crash with Damon Verial
1 × $6.00
How to Predict and Prepare for a Stock Market Crash with Damon Verial
1 × $6.00 -
×
 Forex EURUSD Trader Live Training (2012)
1 × $6.00
Forex EURUSD Trader Live Training (2012)
1 × $6.00 -
×
 The Chaos Course. Cash in on Chaos with Hans Hannula
1 × $6.00
The Chaos Course. Cash in on Chaos with Hans Hannula
1 × $6.00 -
×
 Commodity Speculation for Beginners with Charles Huff, Barbara Marinacci
1 × $6.00
Commodity Speculation for Beginners with Charles Huff, Barbara Marinacci
1 × $6.00 -
×
 Construct & Trade a High Probability Trading System with John L.Person
1 × $6.00
Construct & Trade a High Probability Trading System with John L.Person
1 × $6.00 -
×
 Andy’s EMini Bar – 60 Min System
1 × $6.00
Andy’s EMini Bar – 60 Min System
1 × $6.00 -
×
 Investment Titans: Investment Insights from the Minds that Move Wall Street with Jonathan Burton
1 × $6.00
Investment Titans: Investment Insights from the Minds that Move Wall Street with Jonathan Burton
1 × $6.00 -
×
 Gann’s Secret with Jeanne Long
1 × $4.00
Gann’s Secret with Jeanne Long
1 × $4.00 -
×
 The Ultimate Trading Course Elite & Complete Guide with Sean Dekmar
1 × $31.00
The Ultimate Trading Course Elite & Complete Guide with Sean Dekmar
1 × $31.00 -
×
 Weekly Options Boot Camp with Price Headley
1 × $15.00
Weekly Options Boot Camp with Price Headley
1 × $15.00 -
×
 Trend Trading My Way with Markay Latimer
1 × $15.00
Trend Trading My Way with Markay Latimer
1 × $15.00 -
×
 Rounded Bottom Breakout Multimedia Course
1 × $31.00
Rounded Bottom Breakout Multimedia Course
1 × $31.00 -
×
 Sixpart Study Guide to Market Profile
1 × $6.00
Sixpart Study Guide to Market Profile
1 × $6.00 -
×
 Edz Currency Trading Package with EDZ Trading Academy
1 × $5.00
Edz Currency Trading Package with EDZ Trading Academy
1 × $5.00 -
×
 Home Run Options Trading Course with Dave Aquino - Base Camp Trading
1 × $11.00
Home Run Options Trading Course with Dave Aquino - Base Camp Trading
1 × $11.00 -
×
 Cyclic Analysis. A BreakThrough in Transaction Timing with Cyclitec Services
1 × $6.00
Cyclic Analysis. A BreakThrough in Transaction Timing with Cyclitec Services
1 × $6.00 -
×
 New Market Mavericks with Geoff Cutmore
1 × $6.00
New Market Mavericks with Geoff Cutmore
1 × $6.00 -
×
 Mastering Amibroker Formula Language
1 × $15.00
Mastering Amibroker Formula Language
1 × $15.00 -
×
 The Handbook of Equity Style Management (3rd Ed) with Daniel Coggin & Frank Fabozzi
1 × $6.00
The Handbook of Equity Style Management (3rd Ed) with Daniel Coggin & Frank Fabozzi
1 × $6.00 -
×
 If You Are So Smart Why Aren’t You Rich with Ben Branch
1 × $6.00
If You Are So Smart Why Aren’t You Rich with Ben Branch
1 × $6.00 -
×
 The Practical Guide to Wall Street with Matthew Tagliani
1 × $6.00
The Practical Guide to Wall Street with Matthew Tagliani
1 × $6.00 -
×
 Planetary Harmonics of Speculative Markets with Larry Pesavento
1 × $6.00
Planetary Harmonics of Speculative Markets with Larry Pesavento
1 × $6.00 -
×
 Professor Jeff Bierman's 15 Class Bundle (The Professor's Package)
1 × $6.00
Professor Jeff Bierman's 15 Class Bundle (The Professor's Package)
1 × $6.00 -
×
 The Insured Portfolio: Your Gateway to Stress-Free Global Investments with Erika Nolan, Marc-Andre Sola & Shannon Crouch
1 × $6.00
The Insured Portfolio: Your Gateway to Stress-Free Global Investments with Erika Nolan, Marc-Andre Sola & Shannon Crouch
1 × $6.00 -
×
 Confidence to Hypnotize
1 × $6.00
Confidence to Hypnotize
1 × $6.00 -
×
 KP Trading Room w/ Paladin and JadeCapFX
1 × $5.00
KP Trading Room w/ Paladin and JadeCapFX
1 × $5.00 -
×
 Cyber Trading University - Power Trading 7 CD
1 × $8.00
Cyber Trading University - Power Trading 7 CD
1 × $8.00 -
×
 Essentials Course & Day Trading Strategies with Bear Bull Traders
1 × $13.00
Essentials Course & Day Trading Strategies with Bear Bull Traders
1 × $13.00 -
×
 Sniper Day Trading Workshop DVD course
1 × $23.00
Sniper Day Trading Workshop DVD course
1 × $23.00 -
×
 The A14 Weekly Option Strategy Workshop with Amy Meissner
1 × $23.00
The A14 Weekly Option Strategy Workshop with Amy Meissner
1 × $23.00 -
×
 Gillen Predicts with Jack Gillen
1 × $6.00
Gillen Predicts with Jack Gillen
1 × $6.00 -
×
 Advanced Risk Reversals and Rolling Thunder with Stratagem Trade
1 × $54.00
Advanced Risk Reversals and Rolling Thunder with Stratagem Trade
1 × $54.00 -
×
 Online Investing Hacks with Bonnie Biafore
1 × $6.00
Online Investing Hacks with Bonnie Biafore
1 × $6.00 -
×
 LARGE CAP MOMENTUM STRATEGY with Nick Radge
1 × $179.00
LARGE CAP MOMENTUM STRATEGY with Nick Radge
1 × $179.00 -
×
 Patterns to Profits with Ryan Mallory - Share Planner
1 × $6.00
Patterns to Profits with Ryan Mallory - Share Planner
1 × $6.00 -
×
 HunterFX Video Course with HunterFX
1 × $6.00
HunterFX Video Course with HunterFX
1 × $6.00 -
×
 The Adventures of the Cycle Hunter. The Trader with Craig Bttlc
1 × $6.00
The Adventures of the Cycle Hunter. The Trader with Craig Bttlc
1 × $6.00 -
×
 Trading With Venus
1 × $31.00
Trading With Venus
1 × $31.00 -
×
 The Crash of 1997 (Article) with Hans Hannula
1 × $6.00
The Crash of 1997 (Article) with Hans Hannula
1 × $6.00 -
×
 Empirical Market Microstructure
1 × $6.00
Empirical Market Microstructure
1 × $6.00 -
×
 The Compleat Day Trader with Jake Bernstein
1 × $6.00
The Compleat Day Trader with Jake Bernstein
1 × $6.00 -
×
 Stochastics for the Serious Traders with George Lane
1 × $4.00
Stochastics for the Serious Traders with George Lane
1 × $4.00 -
×
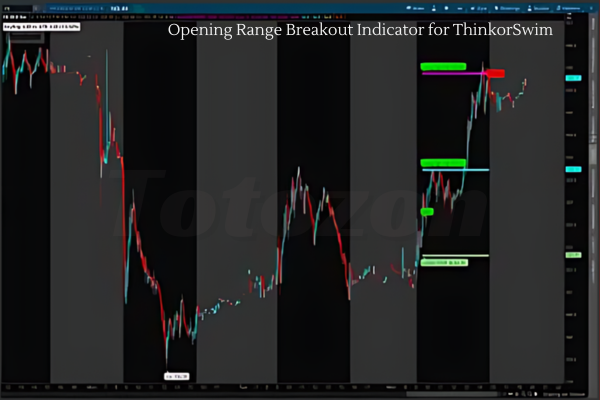 Opening Range Breakout Indicator for ThinkorSwim
1 × $6.00
Opening Range Breakout Indicator for ThinkorSwim
1 × $6.00 -
×
 Sure Thing Stock Investing with Larry Williams
1 × $6.00
Sure Thing Stock Investing with Larry Williams
1 × $6.00 -
×
 Info Product Mastery - Ron Douglas & Alice Seba
1 × $6.00
Info Product Mastery - Ron Douglas & Alice Seba
1 × $6.00 -
×
 The Q’s (2nd Ed.) with Darlene Nelson
1 × $6.00
The Q’s (2nd Ed.) with Darlene Nelson
1 × $6.00 -
×
 Ezaih Academy 2024 Mentorship with Ezaih
1 × $54.00
Ezaih Academy 2024 Mentorship with Ezaih
1 × $54.00 -
×
 Trading with Oscillators. Pinpointing Market Extremes with Mark Etzkorn
1 × $6.00
Trading with Oscillators. Pinpointing Market Extremes with Mark Etzkorn
1 × $6.00 -
×
 Forex Trading Secrets. Trading Strategies for the Forex Market
1 × $6.00
Forex Trading Secrets. Trading Strategies for the Forex Market
1 × $6.00 -
×
 Trading Academy 2024 with Tradeciety
1 × $5.00
Trading Academy 2024 with Tradeciety
1 × $5.00 -
×
 Knowing Where the Energy is Coming From with Charles Drummond
1 × $6.00
Knowing Where the Energy is Coming From with Charles Drummond
1 × $6.00 -
×
 Forex Trading using Intermarket Analysis with Louis Mendelsohn
1 × $6.00
Forex Trading using Intermarket Analysis with Louis Mendelsohn
1 × $6.00 -
×
 ACB Forex Trading Suite with ACB Forex Trading Solutions
1 × $6.00
ACB Forex Trading Suite with ACB Forex Trading Solutions
1 × $6.00 -
×
 Build Your Own Trading System with John Hill
1 × $6.00
Build Your Own Trading System with John Hill
1 × $6.00 -
×
 A Trader’s Guide To Discipline
1 × $6.00
A Trader’s Guide To Discipline
1 × $6.00 -
×
 Forecasting Profits Using Price & Time with Ed Gately
1 × $6.00
Forecasting Profits Using Price & Time with Ed Gately
1 × $6.00 -
×
 Crystal Ball Pack PLUS bonus Live Trade By Pat Mitchell - Trick Trades
1 × $20.00
Crystal Ball Pack PLUS bonus Live Trade By Pat Mitchell - Trick Trades
1 × $20.00 -
×
 Diary of an Internet Trader with Alpesh Patel
1 × $6.00
Diary of an Internet Trader with Alpesh Patel
1 × $6.00 -
×
 FX GOAT 3.0 (STRATEGIES) with FX GOAT FOREX TRADING ACADEMY
1 × $15.00
FX GOAT 3.0 (STRATEGIES) with FX GOAT FOREX TRADING ACADEMY
1 × $15.00 -
×
 ePass Platinum
1 × $31.00
ePass Platinum
1 × $31.00 -
×
 T3 Live - The Simple Art of Trading
1 × $31.00
T3 Live - The Simple Art of Trading
1 × $31.00 -
×
 CNBC 24-7 Trading with Barbara Rockefeller
1 × $6.00
CNBC 24-7 Trading with Barbara Rockefeller
1 × $6.00 -
×
 Mark Sebastian – Gamma Trading Class
1 × $6.00
Mark Sebastian – Gamma Trading Class
1 × $6.00 -
×
 How To Read The Market Professionally with TradeSmart
1 × $27.00
How To Read The Market Professionally with TradeSmart
1 × $27.00 -
×
 Technical Analysis for Short-Term Traders
1 × $6.00
Technical Analysis for Short-Term Traders
1 × $6.00 -
×
 Bootcamp and eBook with Jjwurldin
1 × $24.00
Bootcamp and eBook with Jjwurldin
1 × $24.00 -
×
 The Ten Most Powerful Option Trading Secrets with Bernie Schaeffer
1 × $6.00
The Ten Most Powerful Option Trading Secrets with Bernie Schaeffer
1 × $6.00 -
×
 The Indices Orderflow Masterclass with The Forex Scalpers
1 × $23.00
The Indices Orderflow Masterclass with The Forex Scalpers
1 × $23.00 -
×
 Cheat Code Trading System
1 × $13.00
Cheat Code Trading System
1 × $13.00 -
×
 Advances in International Investments: Traditional and Alternative Approaches with Hung-Gay Fung, Xiaoqing Eleanor Xu & Jot Yau
1 × $6.00
Advances in International Investments: Traditional and Alternative Approaches with Hung-Gay Fung, Xiaoqing Eleanor Xu & Jot Yau
1 × $6.00 -
×
 Larry Connors Professional Day Trading for Success Program
1 × $62.00
Larry Connors Professional Day Trading for Success Program
1 × $62.00 -
×
 Pattern Cycles with Alan Farley
1 × $6.00
Pattern Cycles with Alan Farley
1 × $6.00 -
×
 Restore & Enhance Your Biofield (Advanced) by Spirituality Zone
1 × $15.40
Restore & Enhance Your Biofield (Advanced) by Spirituality Zone
1 × $15.40 -
×
 Mapping the Markets: A Guide to Stock Market Analysis with Deborah Owen & Robin Griffiths
1 × $6.00
Mapping the Markets: A Guide to Stock Market Analysis with Deborah Owen & Robin Griffiths
1 × $6.00 -
×
 Qualitative - Financial Statement Analysis with Sandesh Banger
1 × $5.00
Qualitative - Financial Statement Analysis with Sandesh Banger
1 × $5.00 -
×
 Quantifiable Edges – Gold Subscription with Rob Hanna
1 × $54.00
Quantifiable Edges – Gold Subscription with Rob Hanna
1 × $54.00 -
×
 Math Trading Course 2023
1 × $34.00
Math Trading Course 2023
1 × $34.00 -
×
 Cryptocurrency Investing Master Class with Stone River eLearning
1 × $6.00
Cryptocurrency Investing Master Class with Stone River eLearning
1 × $6.00 -
×
 An Introduction to Market Risk Measurement with Kevin Dowd
1 × $6.00
An Introduction to Market Risk Measurement with Kevin Dowd
1 × $6.00 -
×
 Algo Trading Masterclass with Ali Casey - StatOasis
1 × $23.00
Algo Trading Masterclass with Ali Casey - StatOasis
1 × $23.00 -
×
 Volume Profile 2023 (Elite Pack) with Trader Dale
1 × $5.00
Volume Profile 2023 (Elite Pack) with Trader Dale
1 × $5.00 -
×
 The Fundamentals of Options Trading Basis with Joseph Frey
1 × $6.00
The Fundamentals of Options Trading Basis with Joseph Frey
1 × $6.00 -
×
 Street-Smart Chart Reading – Volume 1 – The Rudiments with Donald G.Worden
1 × $6.00
Street-Smart Chart Reading – Volume 1 – The Rudiments with Donald G.Worden
1 × $6.00 -
×
 SQX Mentorship with Tip Toe Hippo
1 × $23.00
SQX Mentorship with Tip Toe Hippo
1 × $23.00 -
×
 TradeCraft: Your Path to Peak Performance Trading By Adam Grimes
1 × $15.00
TradeCraft: Your Path to Peak Performance Trading By Adam Grimes
1 × $15.00

Practical Introduction to Bollinger Bands 2013
$6.00
File Size: Coming soon!
Delivery Time: 1–12 hours
Media Type: Online Course
Practical Introduction to Bollinger Bands 2013
Understanding Bollinger Bands
What Are Bollinger Bands?
Bollinger Bands are a popular technical analysis tool developed by John Bollinger in the 1980s. They consist of a middle band, which is a simple moving average, and two outer bands that are standard deviations away from the middle band. These bands help traders understand volatility and identify potential buy and sell signals.
Importance in Technical Analysis
Bollinger Bands are essential for traders because they provide a visual representation of price volatility and potential market reversals. They can be applied to various asset classes, including stocks, commodities, and currencies.
Components of Bollinger Bands
The Middle Band
The middle band is typically a 20-day simple moving average (SMA). This average smooths out price data, providing a central value around which the upper and lower bands are calculated.
The Upper and Lower Bands
The upper and lower bands are usually set two standard deviations away from the middle band. These bands expand and contract based on market volatility, offering insights into price movements.
Standard Deviation
Standard deviation measures the dispersion of data from its mean. In Bollinger Bands, it helps determine the distance between the upper and lower bands and the middle band.
Calculating Bollinger Bands
Step-by-Step Calculation
- Calculate the 20-day SMA: Add the closing prices of the past 20 days and divide by 20.
- Determine the standard deviation: Calculate the standard deviation of the same 20-day period.
- Upper Band: Middle Band + (2 * Standard Deviation)
- Lower Band: Middle Band – (2 * Standard Deviation)
Example Calculation
If the 20-day SMA is $100 and the standard deviation is $5, the upper band would be $110 ($100 + (2 * $5)) and the lower band would be $90 ($100 – (2 * $5)).
Using Bollinger Bands in Trading
Identifying Trends
Bollinger Bands can help identify the direction of a trend. When the price consistently touches the upper band, it indicates an uptrend. Conversely, touching the lower band suggests a downtrend.
Overbought and Oversold Conditions
When the price moves near the upper band, the asset might be overbought, signaling a potential sell. If the price approaches the lower band, it might be oversold, indicating a potential buy.
Breakouts and Volatility
Bollinger Bands can also signal breakouts. When the bands squeeze together, it indicates low volatility and a potential breakout. A sudden widening of the bands suggests increased volatility and potential trading opportunities.
Practical Applications
Trading Strategies
Bollinger Bounce
This strategy is based on the idea that the price will revert to the mean. When the price touches the upper band, traders might consider selling. Conversely, touching the lower band might be a buy signal.
Bollinger Squeeze
The Bollinger Squeeze strategy focuses on periods of low volatility. When the bands narrow, it suggests that a breakout is imminent. Traders can prepare to enter positions in the direction of the breakout.
Combining with Other Indicators
Bollinger Bands can be combined with other technical indicators like the Relative Strength Index (RSI) or Moving Average Convergence Divergence (MACD) to enhance trading decisions.
Advantages of Bollinger Bands
Visual Clarity
Bollinger Bands provide a clear visual representation of price volatility, making it easier for traders to identify potential buy and sell signals.
Flexibility
They can be used in various markets and on different time frames, making them versatile tools for traders of all styles.
Reliability
When used correctly, Bollinger Bands can be reliable indicators of market trends and potential reversals.
Limitations of Bollinger Bands
Not a Standalone Indicator
Bollinger Bands should not be used in isolation. They are most effective when combined with other technical analysis tools.
False Signals
Like all technical indicators, Bollinger Bands can produce false signals. Traders should use them with caution and confirm signals with additional analysis.
Tips for Using Bollinger Bands
Customize Settings
Traders can adjust the period and standard deviation settings of Bollinger Bands to suit their trading style and the specific asset being traded.
Monitor Market Conditions
Regularly review market conditions and adjust your trading strategy accordingly. Bollinger Bands are more effective in certain market environments.
Practice and Patience
Successful trading with Bollinger Bands requires practice and patience. Use a demo account to test strategies before applying them to live trading.
Conclusion
Bollinger Bands are a powerful tool for traders, offering insights into market volatility and potential trading opportunities. By understanding their components, calculations, and applications, traders can effectively incorporate Bollinger Bands into their trading strategies to improve their decision-making and profitability.
FAQs
What are Bollinger Bands used for?
Bollinger Bands are used to measure market volatility and identify potential buy and sell signals based on price movements relative to the bands.
How do you calculate Bollinger Bands?
Bollinger Bands are calculated using a 20-day simple moving average and adding/subtracting two standard deviations to create the upper and lower bands.
Can Bollinger Bands be used for day trading?
Yes, Bollinger Bands can be used for day trading, as well as swing trading and long-term investing, due to their flexibility in different time frames.
What is the Bollinger Squeeze?
The Bollinger Squeeze occurs when the bands narrow, indicating low volatility and a potential breakout. It suggests that traders should prepare for a possible significant price move.
Should Bollinger Bands be used with other indicators?
Yes, Bollinger Bands are most effective when used in conjunction with other technical indicators, such as RSI or MACD, to confirm signals and enhance trading decisions.
Be the first to review “Practical Introduction to Bollinger Bands 2013”
You must be logged in to post a review.
Related products

Original price was: $299.00.$8.00Current price is: $8.00.

Original price was: $1,849.00.$15.00Current price is: $15.00.

Original price was: $2,120.00.$15.00Current price is: $15.00.

Original price was: $799.00.$15.00Current price is: $15.00.

Forex Trading
Original price was: $550.00.$5.00Current price is: $5.00.
Forex Trading
Original price was: $2,000.00.$23.00Current price is: $23.00.

Original price was: $1,800.00.$54.00Current price is: $54.00.

Forex Trading
The Complete Guide to Multiple Time Frame Analysis & Reading Price Action with Aiman Almansoori
Original price was: $1,399.00.$13.00Current price is: $13.00.
Original price was: $497.00.$11.00Current price is: $11.00.

Original price was: $999.00.$5.00Current price is: $5.00.
Forex Trading
Original price was: $1,898.00.$10.00Current price is: $10.00.

Original price was: $497.00.$31.00Current price is: $31.00.

Forex Trading
Original price was: $850.00.$23.00Current price is: $23.00.
Forex Trading
Original price was: $2,997.00.$23.00Current price is: $23.00.

Forex Trading
Original price was: $249.00.$15.00Current price is: $15.00.

Forex Trading
Original price was: $2,995.00.$31.00Current price is: $31.00.
Original price was: $4,995.00.$15.00Current price is: $15.00.

Forex Trading
Original price was: $397.00.$31.00Current price is: $31.00.

Forex Trading
Quantamentals – The Next Great Forefront Of Trading and Investing with Trading Markets
Original price was: $1,495.00.$8.00Current price is: $8.00.
Original price was: $450.00.$23.00Current price is: $23.00.

Reviews
There are no reviews yet.