-
×
 ICT Charter Complete Course (2019)
1 × $13.00
ICT Charter Complete Course (2019)
1 × $13.00 -
×
 All About Bonds & Mutual Funds with Esme Faerber
1 × $6.00
All About Bonds & Mutual Funds with Esme Faerber
1 × $6.00 -
×
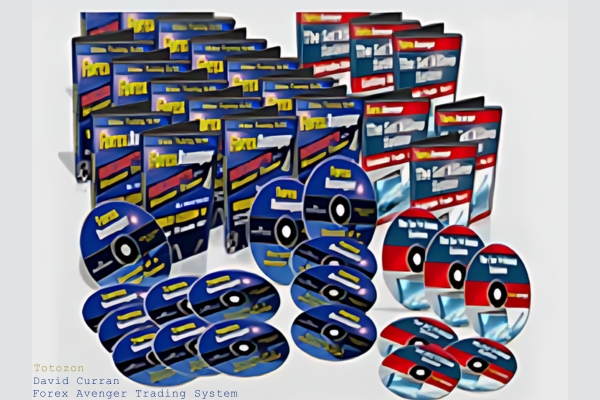 Forex Avenger Trading System with David Curran
1 × $6.00
Forex Avenger Trading System with David Curran
1 × $6.00 -
×
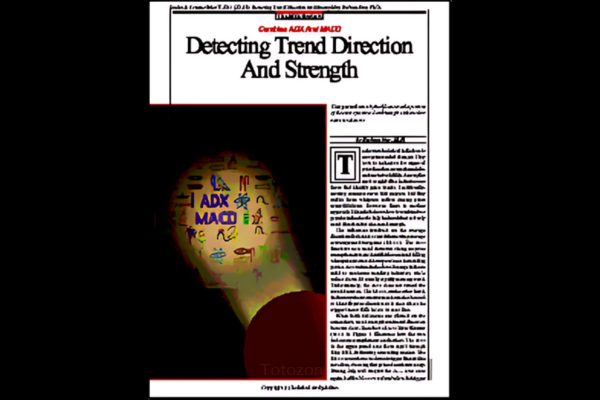 Detecting Trend Direction & Strength (Article) with Barbara Star
1 × $6.00
Detecting Trend Direction & Strength (Article) with Barbara Star
1 × $6.00 -
×
 Foundations of Technical Analysis (Article) with Andrew W.Lo
1 × $6.00
Foundations of Technical Analysis (Article) with Andrew W.Lo
1 × $6.00 -
×
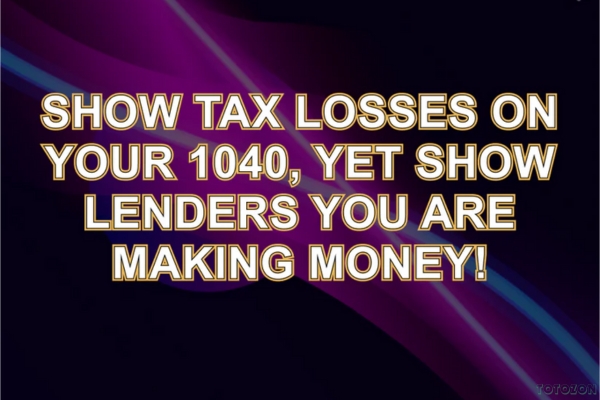 Show Tax Losses On Your 1040, Yet Show Lenders You Are Making Money! with Information Services Unlimited
1 × $6.00
Show Tax Losses On Your 1040, Yet Show Lenders You Are Making Money! with Information Services Unlimited
1 × $6.00 -
×
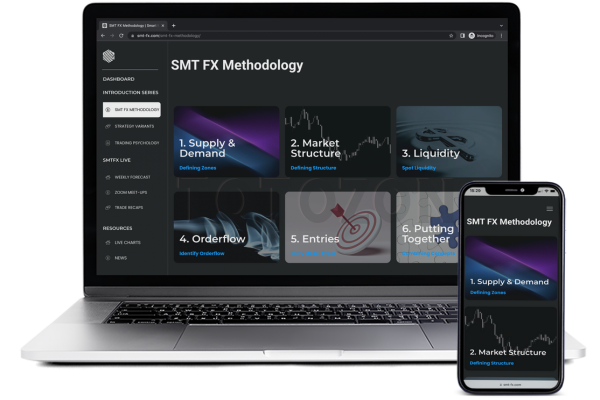 SMT FX Trading
1 × $5.00
SMT FX Trading
1 × $5.00 -
×
 FlowRider Trading Course with Boris Schlossberg and Kathy Lien - Bkforex
1 × $15.00
FlowRider Trading Course with Boris Schlossberg and Kathy Lien - Bkforex
1 × $15.00 -
×
 Squeeze the Markets with Markay Latimer
1 × $6.00
Squeeze the Markets with Markay Latimer
1 × $6.00 -
×
 Best of AM Review (Volume 1-3) with Peter Bain
1 × $6.00
Best of AM Review (Volume 1-3) with Peter Bain
1 × $6.00 -
×
 Trading Natural Resources in a Volatile Market with Kevin Kerr
1 × $6.00
Trading Natural Resources in a Volatile Market with Kevin Kerr
1 × $6.00 -
×
 From Wall Street to the Great Wall with Jonathan Worrall
1 × $6.00
From Wall Street to the Great Wall with Jonathan Worrall
1 × $6.00 -
×
 MTI - Basics UTP
1 × $6.00
MTI - Basics UTP
1 × $6.00 -
×
 Introduction to the Elliot Wave Principle Seminar - Robert Prechter
1 × $6.00
Introduction to the Elliot Wave Principle Seminar - Robert Prechter
1 × $6.00 -
×
 Murrey Math Trading System Book with Murrey Math
1 × $6.00
Murrey Math Trading System Book with Murrey Math
1 × $6.00 -
×
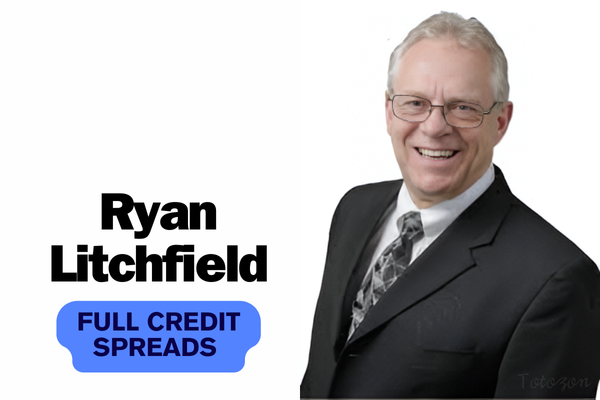 Full Credit Spreads with Ryan Litchfield
1 × $6.00
Full Credit Spreads with Ryan Litchfield
1 × $6.00 -
×
 Build A Solid Foundation For Trading Options with Corey Halliday
1 × $6.00
Build A Solid Foundation For Trading Options with Corey Halliday
1 × $6.00 -
×
 Team Bull Trading Academy
1 × $5.00
Team Bull Trading Academy
1 × $5.00 -
×
 The Apple Way with Jeffrey Cruikshank
1 × $6.00
The Apple Way with Jeffrey Cruikshank
1 × $6.00 -
×
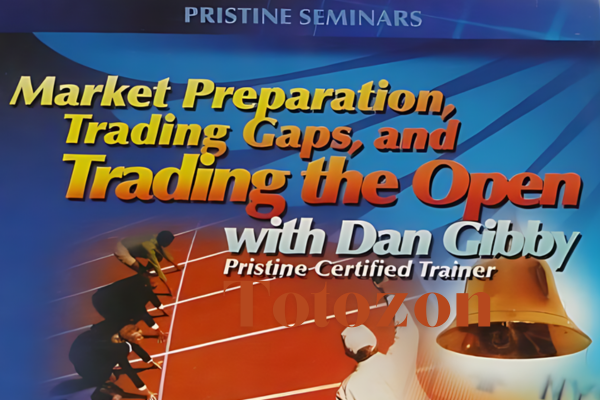 Pristine - Dan Gibby – Market Preparation Trading Gaps & Trading the Open
1 × $6.00
Pristine - Dan Gibby – Market Preparation Trading Gaps & Trading the Open
1 × $6.00 -
×
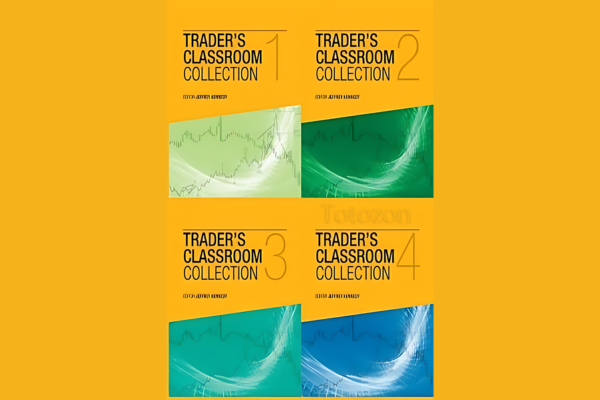 Traders Classroom Collection Volume 1-4 with Jeffrey Kennedy
1 × $15.00
Traders Classroom Collection Volume 1-4 with Jeffrey Kennedy
1 × $15.00 -
×
 Tape Reading Big Caps 1 on 1 with Jtrader
1 × $6.00
Tape Reading Big Caps 1 on 1 with Jtrader
1 × $6.00 -
×
 Investing in 401k Plans with Cliffsnotes
1 × $6.00
Investing in 401k Plans with Cliffsnotes
1 × $6.00 -
×
 Rob’s Swing Trading Methods with Rob Hoffman
1 × $39.00
Rob’s Swing Trading Methods with Rob Hoffman
1 × $39.00 -
×
 Getting Started in Stocks with Alvin D.Hall
1 × $6.00
Getting Started in Stocks with Alvin D.Hall
1 × $6.00 -
×
 Guide to Getting Short and Collecting Income with Don Kaufman
1 × $6.00
Guide to Getting Short and Collecting Income with Don Kaufman
1 × $6.00 -
×
 Time Trap System with Alex Krzhechevsky
1 × $6.00
Time Trap System with Alex Krzhechevsky
1 × $6.00 -
×
 Candlesticks Explained with Martin Pring
1 × $6.00
Candlesticks Explained with Martin Pring
1 × $6.00 -
×
 Simple Smart Forex Renko Program with Nikos Mermigas
1 × $10.00
Simple Smart Forex Renko Program with Nikos Mermigas
1 × $10.00 -
×
 The A14 Weekly Option Strategy Workshop with Amy Meissner
1 × $23.00
The A14 Weekly Option Strategy Workshop with Amy Meissner
1 × $23.00 -
×
 Forex Time Machine with Bill Poulos
1 × $6.00
Forex Time Machine with Bill Poulos
1 × $6.00 -
×
 Precise Exits & Entries with Charles LeBeau
1 × $6.00
Precise Exits & Entries with Charles LeBeau
1 × $6.00 -
×
 Bird Watch in Lion Country 2010 Ed with Dirk Du Toit
1 × $6.00
Bird Watch in Lion Country 2010 Ed with Dirk Du Toit
1 × $6.00 -
×
 Systems Mastery Course with Chris Dover - Pollinate Trading
1 × $5.00
Systems Mastery Course with Chris Dover - Pollinate Trading
1 × $5.00 -
×
 All About Technical Analysis with Constance Brown
1 × $6.00
All About Technical Analysis with Constance Brown
1 × $6.00 -
×
 Profiting In Bull Or Bear Markets with George Dagnino
1 × $6.00
Profiting In Bull Or Bear Markets with George Dagnino
1 × $6.00 -
×
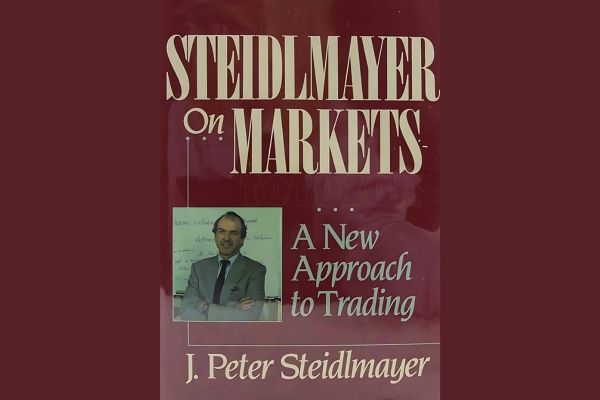 Steidlmayer On Markets. A New Approach to Trading with J.Peter Steidlmayer
1 × $6.00
Steidlmayer On Markets. A New Approach to Trading with J.Peter Steidlmayer
1 × $6.00 -
×
 CANDLESTICKS APPLIED with Steve Nison & Syl Desaulniers - Candle Charts
1 × $15.00
CANDLESTICKS APPLIED with Steve Nison & Syl Desaulniers - Candle Charts
1 × $15.00 -
×
 The Orderflows Trade Opportunities Encyclopedia with Michael Valtos
1 × $8.00
The Orderflows Trade Opportunities Encyclopedia with Michael Valtos
1 × $8.00 -
×
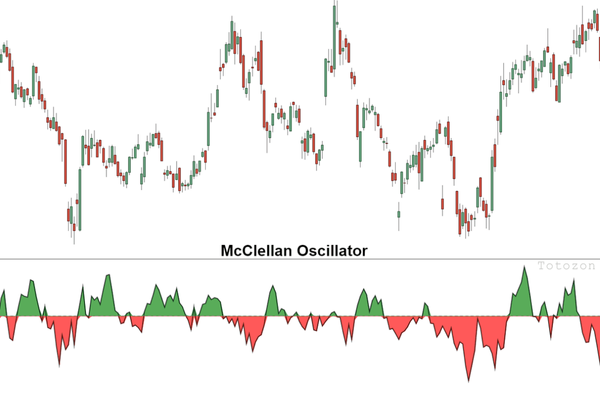 The McClellan Oscillator and Other Tools for with Tom McClellan
1 × $6.00
The McClellan Oscillator and Other Tools for with Tom McClellan
1 × $6.00 -
×
 Professional Swing Trading College with Steven Primo
1 × $15.00
Professional Swing Trading College with Steven Primo
1 × $15.00 -
×
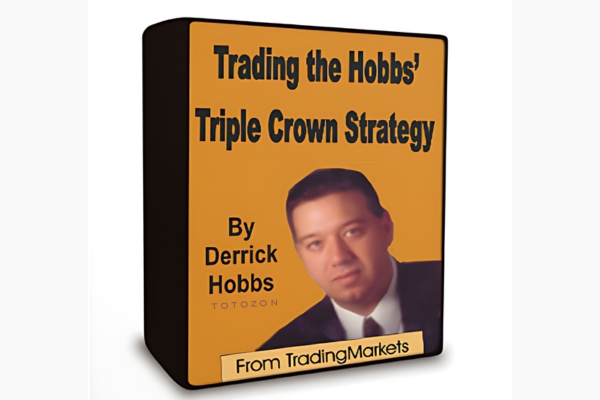 Trading The Hobbs Triple Crown Strategy with Derrik Hobbs
1 × $6.00
Trading The Hobbs Triple Crown Strategy with Derrik Hobbs
1 × $6.00 -
×
 SO FX Educational Course with SO FX
1 × $5.00
SO FX Educational Course with SO FX
1 × $5.00 -
×
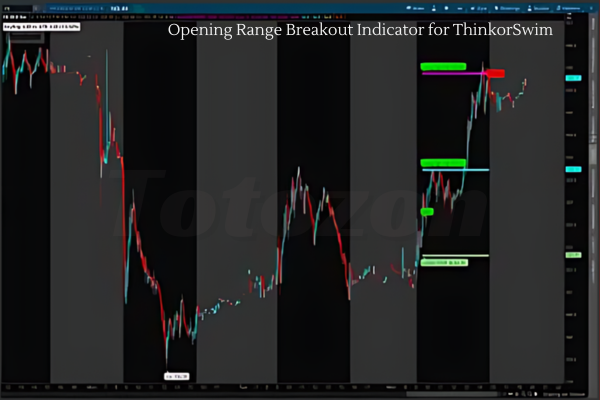 Opening Range Breakout Indicator for ThinkorSwim
1 × $6.00
Opening Range Breakout Indicator for ThinkorSwim
1 × $6.00 -
×
 European Members - March 2023 with Stockbee
1 × $5.00
European Members - March 2023 with Stockbee
1 × $5.00 -
×
 How to Collect Income Being Short with Don Kaufman
1 × $6.00
How to Collect Income Being Short with Don Kaufman
1 × $6.00 -
×
 How to Avoid Tax on Your Stock Market Profits with Lee Hadnum
1 × $6.00
How to Avoid Tax on Your Stock Market Profits with Lee Hadnum
1 × $6.00 -
×
 Gann Masters II with Hallikers Inc
1 × $6.00
Gann Masters II with Hallikers Inc
1 × $6.00 -
×
 FOREX MASTER TRADING COURSE with BKFOREX
1 × $5.00
FOREX MASTER TRADING COURSE with BKFOREX
1 × $5.00 -
×
 Dynamic Trader 6 Dynamic Trader Real Time and End Of Day
1 × $6.00
Dynamic Trader 6 Dynamic Trader Real Time and End Of Day
1 × $6.00 -
×
 Keynes & The Market with Justyn Walsh
1 × $6.00
Keynes & The Market with Justyn Walsh
1 × $6.00 -
×
 The Cash Flow Bootcamp with John Macgregor
1 × $233.00
The Cash Flow Bootcamp with John Macgregor
1 × $233.00 -
×
 The Market Maker’s Edge with Josh Lukeman
1 × $6.00
The Market Maker’s Edge with Josh Lukeman
1 × $6.00 -
×
![Robert Miner-Complete Price Tutorial Series [5 Videos (AVI)] img](https://www.totozon.com/wp-content/uploads/2024/05/Robert-Miner-Complete-Price-Tutorial-Series-5-Videos-AVI-img.png) Robert Miner-Complete Price Tutorial Series [5 Videos (AVI)]
1 × $6.00
Robert Miner-Complete Price Tutorial Series [5 Videos (AVI)]
1 × $6.00 -
×
 Pring on Price Patterns with Martin Pring
1 × $6.00
Pring on Price Patterns with Martin Pring
1 × $6.00 -
×
 You AreThe Indicator Online Course
1 × $31.00
You AreThe Indicator Online Course
1 × $31.00 -
×
 Day Trading and Swing Trading Futures with Price Action by Humberto Malaspina
1 × $5.00
Day Trading and Swing Trading Futures with Price Action by Humberto Malaspina
1 × $5.00 -
×
 The Market Matrix
1 × $6.00
The Market Matrix
1 × $6.00 -
×
 The Binary Trigger (Video, Books) with John Piper
1 × $6.00
The Binary Trigger (Video, Books) with John Piper
1 × $6.00 -
×
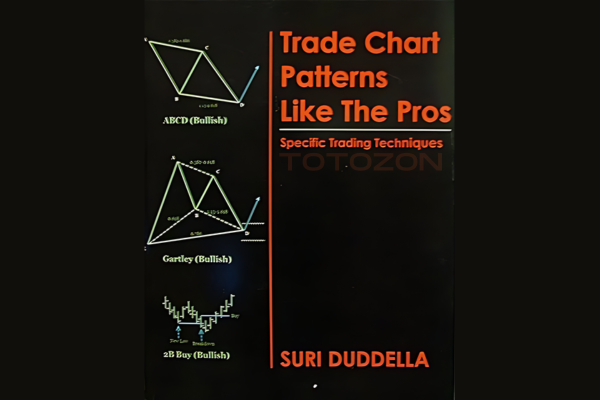 Trade Chart Patterns Like The Pros with Suri Duddella
1 × $6.00
Trade Chart Patterns Like The Pros with Suri Duddella
1 × $6.00 -
×
 Golden Pips Generator - DMA HACK with Hooman
1 × $62.00
Golden Pips Generator - DMA HACK with Hooman
1 × $62.00 -
×
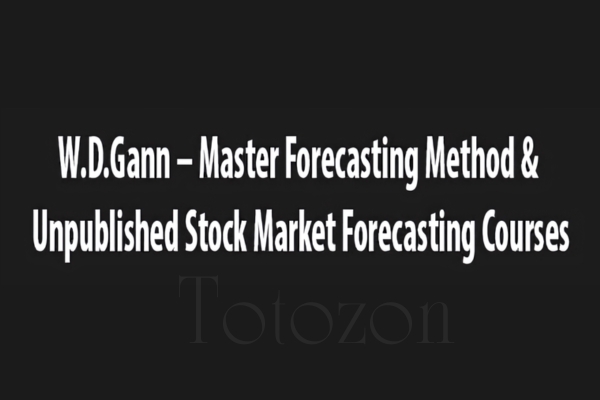 Master Forecasting Method & Unpublished Stock Market Forecasting Courses with W.D.Gann
1 × $6.00
Master Forecasting Method & Unpublished Stock Market Forecasting Courses with W.D.Gann
1 × $6.00 -
×
 Quantitative Trading Strategies (1st Edition) with Lars Kestner
1 × $6.00
Quantitative Trading Strategies (1st Edition) with Lars Kestner
1 × $6.00 -
×
 Secrets of a Winning Trader with Gareth Soloway
1 × $871.00
Secrets of a Winning Trader with Gareth Soloway
1 × $871.00 -
×
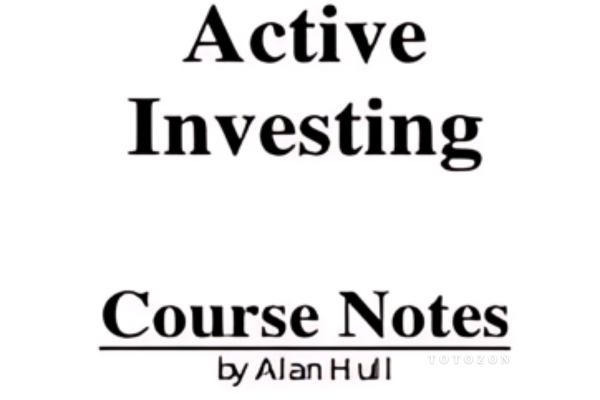 Active Investing courses notes with Alan Hull
1 × $6.00
Active Investing courses notes with Alan Hull
1 × $6.00 -
×
 In Jeremy's Stock Market Brain
1 × $62.00
In Jeremy's Stock Market Brain
1 × $62.00 -
×
 Rich in America: Secrets to Creating and Preserving Wealth with Jeffrey Maurer
1 × $6.00
Rich in America: Secrets to Creating and Preserving Wealth with Jeffrey Maurer
1 × $6.00 -
×
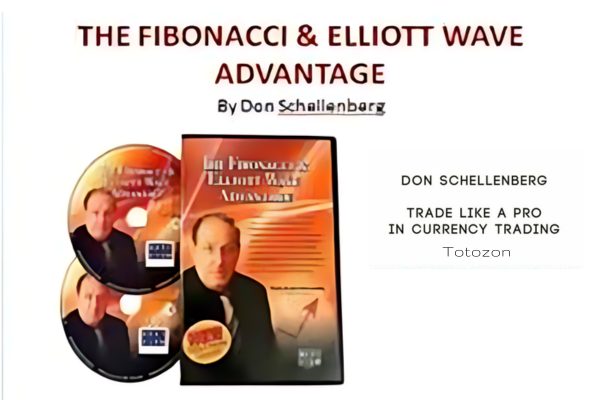 Trade Like a Pro in Currency Trading with Don Schellenberg
1 × $6.00
Trade Like a Pro in Currency Trading with Don Schellenberg
1 × $6.00 -
×
 Century Capital Group Course with Dylan Forexia
1 × $6.00
Century Capital Group Course with Dylan Forexia
1 × $6.00 -
×
 What Products to Watch and Why Class with Don Kaufman
1 × $6.00
What Products to Watch and Why Class with Don Kaufman
1 × $6.00 -
×
 Money Attraction Bootcamp - Video + Audio + Workbook by Greg Habstritt
1 × $6.00
Money Attraction Bootcamp - Video + Audio + Workbook by Greg Habstritt
1 × $6.00 -
×
 FestX Main Online video Course with Clint Fester
1 × $5.00
FestX Main Online video Course with Clint Fester
1 × $5.00 -
×
 Robotic trading interactive
1 × $31.00
Robotic trading interactive
1 × $31.00 -
×
 Street-Smart Chart Reading – Volume 1 – The Rudiments with Donald G.Worden
1 × $6.00
Street-Smart Chart Reading – Volume 1 – The Rudiments with Donald G.Worden
1 × $6.00 -
×
 An Introduction to Market Risk Measurement with Kevin Dowd
1 × $6.00
An Introduction to Market Risk Measurement with Kevin Dowd
1 × $6.00 -
×
 Investing with LEAPS. What You Should Know About Long Term Investing with James Bittman
1 × $6.00
Investing with LEAPS. What You Should Know About Long Term Investing with James Bittman
1 × $6.00 -
×
 Sell & Sell Short with Alexander Elder
1 × $6.00
Sell & Sell Short with Alexander Elder
1 × $6.00 -
×
 Forex Trading Course with Mike Norman
1 × $17.00
Forex Trading Course with Mike Norman
1 × $17.00 -
×
 Gold Trading Academy Video Course
1 × $23.00
Gold Trading Academy Video Course
1 × $23.00 -
×
 FX Funding Mate Course
1 × $5.00
FX Funding Mate Course
1 × $5.00 -
×
 The Indices Orderflow Masterclass with The Forex Scalpers
1 × $23.00
The Indices Orderflow Masterclass with The Forex Scalpers
1 × $23.00 -
×
 Options 201: Vertical and Calendar Spread Essentials 5 Part Class with Don Kaufman On Demand Replay
1 × $6.00
Options 201: Vertical and Calendar Spread Essentials 5 Part Class with Don Kaufman On Demand Replay
1 × $6.00 -
×
 How I Trade Options with Jon Najarian
1 × $4.00
How I Trade Options with Jon Najarian
1 × $4.00 -
×
 Profiting With Forex: The Most Effective Tools and Techniques for Trading Currencies - John Jagerson & Wade Hansen
1 × $6.00
Profiting With Forex: The Most Effective Tools and Techniques for Trading Currencies - John Jagerson & Wade Hansen
1 × $6.00 -
×
 WondaFX Signature Strategy with WondaFX
1 × $5.00
WondaFX Signature Strategy with WondaFX
1 × $5.00 -
×
 Learn To Fish Part III - How To Swing Trade for Consistent Gains with Daniel
1 × $15.00
Learn To Fish Part III - How To Swing Trade for Consistent Gains with Daniel
1 × $15.00 -
×
 The GBP USD Trading System with A.Heuscher
1 × $6.00
The GBP USD Trading System with A.Heuscher
1 × $6.00 -
×
 Home Run Options Trading Course with Dave Aquino - Base Camp Trading
1 × $11.00
Home Run Options Trading Course with Dave Aquino - Base Camp Trading
1 × $11.00 -
×
 Crash Course Special Edition Set with Chris Martenson
1 × $6.00
Crash Course Special Edition Set with Chris Martenson
1 × $6.00 -
×
 The Heart Friendly Butterfly Options Trading System Four Part Video Series with Seth Freudberg
1 × $78.00
The Heart Friendly Butterfly Options Trading System Four Part Video Series with Seth Freudberg
1 × $78.00 -
×
 Dumb Money: Adventures of a Day Trader with Joey Anuff
1 × $6.00
Dumb Money: Adventures of a Day Trader with Joey Anuff
1 × $6.00 -
×
 Cycles: What they are, what they mean, how to profit by them - Dick Stoken
1 × $6.00
Cycles: What they are, what they mean, how to profit by them - Dick Stoken
1 × $6.00 -
×
 Investment Illusions with Martin S.Fridson
1 × $6.00
Investment Illusions with Martin S.Fridson
1 × $6.00 -
×
 The Superstock Investor with Charles LaLoggia
1 × $6.00
The Superstock Investor with Charles LaLoggia
1 × $6.00 -
×
 Handbook of Integral Equations with Andrei D.Polyanin, Alexander V.Manzhirov
1 × $6.00
Handbook of Integral Equations with Andrei D.Polyanin, Alexander V.Manzhirov
1 × $6.00 -
×
 Fundamentals Trading
1 × $6.00
Fundamentals Trading
1 × $6.00 -
×
 Football Hedging System with Tony Langley
1 × $54.00
Football Hedging System with Tony Langley
1 × $54.00 -
×
 Analysis of Equity Investments: Valuation with John Stowe, Thomas Robinson, Jerald Pinto & Dennis McLeavey
1 × $6.00
Analysis of Equity Investments: Valuation with John Stowe, Thomas Robinson, Jerald Pinto & Dennis McLeavey
1 × $6.00 -
×
 A Complete Guide to Technical Trading Tactics with John Person
1 × $6.00
A Complete Guide to Technical Trading Tactics with John Person
1 × $6.00 -
×
 The Age of Turbulence with Alan Greenspan
1 × $6.00
The Age of Turbulence with Alan Greenspan
1 × $6.00 -
×
 SPX All Put Flat ButterFly with Mark Fenton - Sheridan Options Mentoring
1 × $39.00
SPX All Put Flat ButterFly with Mark Fenton - Sheridan Options Mentoring
1 × $39.00 -
×
 Trading With an Edge with Bruce Gilmore
1 × $6.00
Trading With an Edge with Bruce Gilmore
1 × $6.00 -
×
 How Do You Read Charts? A Guide to Classic Price Pattern Recognition Class with Professor Jeff Bierman
1 × $6.00
How Do You Read Charts? A Guide to Classic Price Pattern Recognition Class with Professor Jeff Bierman
1 × $6.00 -
×
 Forex Trading Course with Zack Kolundzic
1 × $6.00
Forex Trading Course with Zack Kolundzic
1 × $6.00 -
×
 The Basics of the Wave Principle with Wayne Gorman
1 × $15.00
The Basics of the Wave Principle with Wayne Gorman
1 × $15.00 -
×
 Market Expectations & Option Prices with Martin Mandler
1 × $6.00
Market Expectations & Option Prices with Martin Mandler
1 × $6.00 -
×
 ICT Prodigy Trading Course – $650K in Payouts with Alex Solignani
1 × $15.00
ICT Prodigy Trading Course – $650K in Payouts with Alex Solignani
1 × $15.00 -
×
 Essentials in Quantitative Trading QT01 By HangukQuant's
1 × $23.00
Essentials in Quantitative Trading QT01 By HangukQuant's
1 × $23.00

Practical Introduction to Bollinger Bands 2013
$6.00
File Size: Coming soon!
Delivery Time: 1–12 hours
Media Type: Online Course
Practical Introduction to Bollinger Bands 2013
Understanding Bollinger Bands
What Are Bollinger Bands?
Bollinger Bands are a popular technical analysis tool developed by John Bollinger in the 1980s. They consist of a middle band, which is a simple moving average, and two outer bands that are standard deviations away from the middle band. These bands help traders understand volatility and identify potential buy and sell signals.
Importance in Technical Analysis
Bollinger Bands are essential for traders because they provide a visual representation of price volatility and potential market reversals. They can be applied to various asset classes, including stocks, commodities, and currencies.
Components of Bollinger Bands
The Middle Band
The middle band is typically a 20-day simple moving average (SMA). This average smooths out price data, providing a central value around which the upper and lower bands are calculated.
The Upper and Lower Bands
The upper and lower bands are usually set two standard deviations away from the middle band. These bands expand and contract based on market volatility, offering insights into price movements.
Standard Deviation
Standard deviation measures the dispersion of data from its mean. In Bollinger Bands, it helps determine the distance between the upper and lower bands and the middle band.
Calculating Bollinger Bands
Step-by-Step Calculation
- Calculate the 20-day SMA: Add the closing prices of the past 20 days and divide by 20.
- Determine the standard deviation: Calculate the standard deviation of the same 20-day period.
- Upper Band: Middle Band + (2 * Standard Deviation)
- Lower Band: Middle Band – (2 * Standard Deviation)
Example Calculation
If the 20-day SMA is $100 and the standard deviation is $5, the upper band would be $110 ($100 + (2 * $5)) and the lower band would be $90 ($100 – (2 * $5)).
Using Bollinger Bands in Trading
Identifying Trends
Bollinger Bands can help identify the direction of a trend. When the price consistently touches the upper band, it indicates an uptrend. Conversely, touching the lower band suggests a downtrend.
Overbought and Oversold Conditions
When the price moves near the upper band, the asset might be overbought, signaling a potential sell. If the price approaches the lower band, it might be oversold, indicating a potential buy.
Breakouts and Volatility
Bollinger Bands can also signal breakouts. When the bands squeeze together, it indicates low volatility and a potential breakout. A sudden widening of the bands suggests increased volatility and potential trading opportunities.
Practical Applications
Trading Strategies
Bollinger Bounce
This strategy is based on the idea that the price will revert to the mean. When the price touches the upper band, traders might consider selling. Conversely, touching the lower band might be a buy signal.
Bollinger Squeeze
The Bollinger Squeeze strategy focuses on periods of low volatility. When the bands narrow, it suggests that a breakout is imminent. Traders can prepare to enter positions in the direction of the breakout.
Combining with Other Indicators
Bollinger Bands can be combined with other technical indicators like the Relative Strength Index (RSI) or Moving Average Convergence Divergence (MACD) to enhance trading decisions.
Advantages of Bollinger Bands
Visual Clarity
Bollinger Bands provide a clear visual representation of price volatility, making it easier for traders to identify potential buy and sell signals.
Flexibility
They can be used in various markets and on different time frames, making them versatile tools for traders of all styles.
Reliability
When used correctly, Bollinger Bands can be reliable indicators of market trends and potential reversals.
Limitations of Bollinger Bands
Not a Standalone Indicator
Bollinger Bands should not be used in isolation. They are most effective when combined with other technical analysis tools.
False Signals
Like all technical indicators, Bollinger Bands can produce false signals. Traders should use them with caution and confirm signals with additional analysis.
Tips for Using Bollinger Bands
Customize Settings
Traders can adjust the period and standard deviation settings of Bollinger Bands to suit their trading style and the specific asset being traded.
Monitor Market Conditions
Regularly review market conditions and adjust your trading strategy accordingly. Bollinger Bands are more effective in certain market environments.
Practice and Patience
Successful trading with Bollinger Bands requires practice and patience. Use a demo account to test strategies before applying them to live trading.
Conclusion
Bollinger Bands are a powerful tool for traders, offering insights into market volatility and potential trading opportunities. By understanding their components, calculations, and applications, traders can effectively incorporate Bollinger Bands into their trading strategies to improve their decision-making and profitability.
FAQs
What are Bollinger Bands used for?
Bollinger Bands are used to measure market volatility and identify potential buy and sell signals based on price movements relative to the bands.
How do you calculate Bollinger Bands?
Bollinger Bands are calculated using a 20-day simple moving average and adding/subtracting two standard deviations to create the upper and lower bands.
Can Bollinger Bands be used for day trading?
Yes, Bollinger Bands can be used for day trading, as well as swing trading and long-term investing, due to their flexibility in different time frames.
What is the Bollinger Squeeze?
The Bollinger Squeeze occurs when the bands narrow, indicating low volatility and a potential breakout. It suggests that traders should prepare for a possible significant price move.
Should Bollinger Bands be used with other indicators?
Yes, Bollinger Bands are most effective when used in conjunction with other technical indicators, such as RSI or MACD, to confirm signals and enhance trading decisions.
Be the first to review “Practical Introduction to Bollinger Bands 2013”
You must be logged in to post a review.
Related products

Original price was: $1,200.00.$23.00Current price is: $23.00.

Forex Trading
Original price was: $797.00.$10.00Current price is: $10.00.

Forex Trading
Original price was: $239.00.$8.00Current price is: $8.00.
Original price was: $299.00.$8.00Current price is: $8.00.

Original price was: $497.00.$31.00Current price is: $31.00.
Forex Trading
Original price was: $850.00.$23.00Current price is: $23.00.

Forex Trading
Original price was: $249.00.$15.00Current price is: $15.00.

Original price was: $197.00.$5.00Current price is: $5.00.
Forex Trading
Original price was: $550.00.$5.00Current price is: $5.00.

Forex Trading
The Complete Guide to Multiple Time Frame Analysis & Reading Price Action with Aiman Almansoori
Original price was: $1,399.00.$13.00Current price is: $13.00.

Original price was: $649.00.$20.00Current price is: $20.00.
Original price was: $497.00.$11.00Current price is: $11.00.

Forex Trading
Original price was: $2,997.00.$23.00Current price is: $23.00.

Forex Trading
Original price was: $1,098.00.$39.00Current price is: $39.00.
Original price was: $310.00.$23.00Current price is: $23.00.

Original price was: $1,849.00.$15.00Current price is: $15.00.

Forex Trading
Original price was: $499.00.$15.00Current price is: $15.00.
Original price was: $450.00.$23.00Current price is: $23.00.

Original price was: $799.00.$15.00Current price is: $15.00.

Original price was: $700.00.$39.00Current price is: $39.00.

Reviews
There are no reviews yet.