-
×
 Fractal Flow Strategy Video Course with Fractal Flow Pro
1 × $6.00
Fractal Flow Strategy Video Course with Fractal Flow Pro
1 × $6.00 -
×
 Collection of Articles and Webinars with Sunil Mangwani [9 Videos (FLVs) + 14 eBooks
1 × $6.00
Collection of Articles and Webinars with Sunil Mangwani [9 Videos (FLVs) + 14 eBooks
1 × $6.00 -
×
 The Ultimate Forex Structure Course
1 × $31.00
The Ultimate Forex Structure Course
1 × $31.00 -
×
 Candlesticks Explained with Martin Pring
1 × $6.00
Candlesticks Explained with Martin Pring
1 × $6.00 -
×
 Accelerated Learning Techniques in Action with Colin Rose, Jayne Nicholl & Malcolm Nicholl
1 × $6.00
Accelerated Learning Techniques in Action with Colin Rose, Jayne Nicholl & Malcolm Nicholl
1 × $6.00 -
×
 The Adventures of the Cycle Hunter. The Trader with Craig Bttlc
1 × $6.00
The Adventures of the Cycle Hunter. The Trader with Craig Bttlc
1 × $6.00 -
×
 Best of Livestock with Timothy Sykes
1 × $5.00
Best of Livestock with Timothy Sykes
1 × $5.00 -
×
 Contrarian Investment Strategies: The Next Generation with David Dreman
1 × $4.00
Contrarian Investment Strategies: The Next Generation with David Dreman
1 × $4.00 -
×
 Master Class Recording 2019 with Oil Trading Academy
1 × $17.00
Master Class Recording 2019 with Oil Trading Academy
1 × $17.00 -
×
 Investment Philosophies
1 × $6.00
Investment Philosophies
1 × $6.00 -
×
 Futures Trading Secrets Home Study Course 2008 with Bill McCready
1 × $6.00
Futures Trading Secrets Home Study Course 2008 with Bill McCready
1 × $6.00 -
×
 HEDGED STRATEGY SERIES IN VOLATILE MARKETS – HEDGED CREDIT SPREADS - Dan Sheridan
1 × $6.00
HEDGED STRATEGY SERIES IN VOLATILE MARKETS – HEDGED CREDIT SPREADS - Dan Sheridan
1 × $6.00 -
×
 The Internet Trading Course with Alpesh Patel
1 × $6.00
The Internet Trading Course with Alpesh Patel
1 × $6.00 -
×
 Equity Trader 101 Course with KeyStone Trading
1 × $6.00
Equity Trader 101 Course with KeyStone Trading
1 × $6.00 -
×
 Investing Under Fire with Alan R.Ackerman
1 × $6.00
Investing Under Fire with Alan R.Ackerman
1 × $6.00 -
×
 Divorcing the Dow: Using Revolutionary Market Indicators to Profit from the Stealth Boom Ahead - Jim Troup & Sharon Michalsky
1 × $6.00
Divorcing the Dow: Using Revolutionary Market Indicators to Profit from the Stealth Boom Ahead - Jim Troup & Sharon Michalsky
1 × $6.00 -
×
 How I Trade Options with Jon Najarian
1 × $4.00
How I Trade Options with Jon Najarian
1 × $4.00 -
×
 Core Concepts Mastery with DreamsFX
1 × $5.00
Core Concepts Mastery with DreamsFX
1 × $5.00 -
×
 Investing with LEAPS. What You Should Know About Long Term Investing with James Bittman
1 × $6.00
Investing with LEAPS. What You Should Know About Long Term Investing with James Bittman
1 × $6.00 -
×
 Monetary Mechanics Course 2024 with The Macro Compass
1 × $139.00
Monetary Mechanics Course 2024 with The Macro Compass
1 × $139.00 -
×
 Candlestick Charts with Clive Lambert
1 × $6.00
Candlestick Charts with Clive Lambert
1 × $6.00 -
×
 Advanced Spread Trading with Guy Bower - MasterClass Trader
1 × $15.00
Advanced Spread Trading with Guy Bower - MasterClass Trader
1 × $15.00 -
×
 Hedges on Hedge Funds: How to Successfully Analyze and Select an Investment with James Hedges
1 × $6.00
Hedges on Hedge Funds: How to Successfully Analyze and Select an Investment with James Hedges
1 × $6.00 -
×
 AllStreet Investing - Master the Market LEVEL 2 - DAYTRADING
1 × $23.00
AllStreet Investing - Master the Market LEVEL 2 - DAYTRADING
1 × $23.00 -
×
 Complete Price Action, Volume Profile and Orderflow Trading Bundle with Price Action Volume Trader
1 × $78.00
Complete Price Action, Volume Profile and Orderflow Trading Bundle with Price Action Volume Trader
1 × $78.00 -
×
 Active Beta Indexes with Khalid Ghayur
1 × $6.00
Active Beta Indexes with Khalid Ghayur
1 × $6.00 -
×
 Speculating with Futures and Traditional Commodities Part II (Liverpool Group) - Noble DraKoln
1 × $6.00
Speculating with Futures and Traditional Commodities Part II (Liverpool Group) - Noble DraKoln
1 × $6.00 -
×
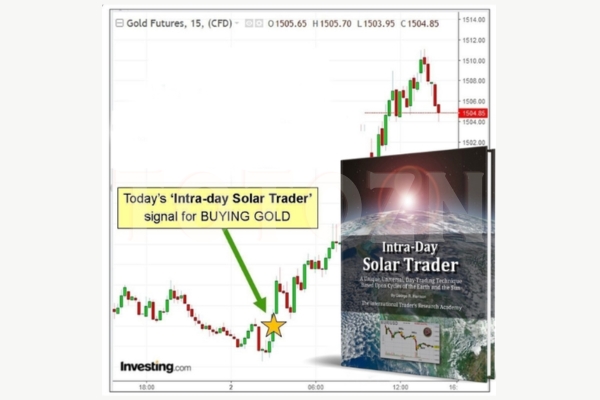 Intra-day Solar Trader with George Harrison
1 × $17.00
Intra-day Solar Trader with George Harrison
1 × $17.00 -
×
 The LP Trading Course
1 × $13.00
The LP Trading Course
1 × $13.00 -
×
 Options 101 - The Basics and Beyond Class A 5-Part Course with Don Kaufman
1 × $6.00
Options 101 - The Basics and Beyond Class A 5-Part Course with Don Kaufman
1 × $6.00 -
×
 Developing the Psychological Trader’s Edge with Robin Dayne
1 × $6.00
Developing the Psychological Trader’s Edge with Robin Dayne
1 × $6.00 -
×
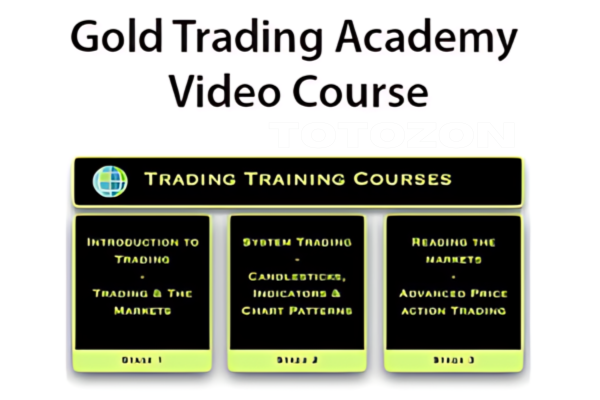 Gold Trading Academy Video Course
1 × $23.00
Gold Trading Academy Video Course
1 × $23.00 -
×
 How to Find the Most Profitable Stocks with Mubarak Shah
1 × $6.00
How to Find the Most Profitable Stocks with Mubarak Shah
1 × $6.00 -
×
 White Phoenix’s The Smart (Money) Approach to Trading with Jayson Casper
1 × $39.00
White Phoenix’s The Smart (Money) Approach to Trading with Jayson Casper
1 × $39.00 -
×
 Adx Mastery Complete Course
1 × $6.00
Adx Mastery Complete Course
1 × $6.00 -
×
 Weekly Options Trading Advantage Class with Doc Severson
1 × $6.00
Weekly Options Trading Advantage Class with Doc Severson
1 × $6.00 -
×
 Relationship of the StockMarket Fluctuations to the Lunarcycle with Frank J.Guarino
1 × $6.00
Relationship of the StockMarket Fluctuations to the Lunarcycle with Frank J.Guarino
1 × $6.00 -
×
 Art & Science of Trend Trading Class with Jeff Bierman
1 × $6.00
Art & Science of Trend Trading Class with Jeff Bierman
1 × $6.00 -
×
 The Inve$tment A$trology Articles with Alan Richter
1 × $6.00
The Inve$tment A$trology Articles with Alan Richter
1 × $6.00 -
×
 Self-Mastery Course with Steven Cruz
1 × $62.00
Self-Mastery Course with Steven Cruz
1 × $62.00 -
×
 Candlestick Trading for Maximum Profitsn with B.M.Davis
1 × $6.00
Candlestick Trading for Maximum Profitsn with B.M.Davis
1 × $6.00 -
×
 Essentials Course & Day Trading Strategies with Bear Bull Traders
1 × $13.00
Essentials Course & Day Trading Strategies with Bear Bull Traders
1 × $13.00 -
×
 T3 Live - The Simple Art of Trading
1 × $31.00
T3 Live - The Simple Art of Trading
1 × $31.00 -
×
 Pattern Recognition: A Fundamental Introduction to Japanese Candlestick Charting Techniques Class with Jeff Bierman
1 × $6.00
Pattern Recognition: A Fundamental Introduction to Japanese Candlestick Charting Techniques Class with Jeff Bierman
1 × $6.00 -
×
 How I Trade Growth Stocks In Bull And Bear Markets
1 × $54.00
How I Trade Growth Stocks In Bull And Bear Markets
1 × $54.00 -
×
 The Ticker Investment Digest Articles
1 × $6.00
The Ticker Investment Digest Articles
1 × $6.00 -
×
 The Beginners Guide to Commodities Investing with Brian & Gayle Rice
1 × $6.00
The Beginners Guide to Commodities Investing with Brian & Gayle Rice
1 × $6.00 -
×
 Royal Exchange Forex with Jan Teslar
1 × $6.00
Royal Exchange Forex with Jan Teslar
1 × $6.00 -
×
 Simple Forex Profits with Rayy Bannzz
1 × $31.00
Simple Forex Profits with Rayy Bannzz
1 × $31.00 -
×
 Fibonacci for the Active Trader with Derrik Hobbs
1 × $6.00
Fibonacci for the Active Trader with Derrik Hobbs
1 × $6.00 -
×
 ProfileTraders - Advanced Market Profile (May 2014)
1 × $6.00
ProfileTraders - Advanced Market Profile (May 2014)
1 × $6.00 -
×
 Candlestick Charting Explained with Greg Morris
1 × $8.00
Candlestick Charting Explained with Greg Morris
1 × $8.00 -
×
 DFX Scalping Strategy Course with Disciplined FX
1 × $23.00
DFX Scalping Strategy Course with Disciplined FX
1 × $23.00 -
×
 The Master Indicator 2023 with Lance Ippolito
1 × $101.00
The Master Indicator 2023 with Lance Ippolito
1 × $101.00 -
×
 Four Dimensional Stock Market Structures & Cycles with Bradley Cowan
1 × $6.00
Four Dimensional Stock Market Structures & Cycles with Bradley Cowan
1 × $6.00 -
×
 How You Can Be Right While the Crowd Loses with Jack Bernstein
1 × $6.00
How You Can Be Right While the Crowd Loses with Jack Bernstein
1 × $6.00 -
×
 Fast Start Barter System with Bob Meyer
1 × $31.00
Fast Start Barter System with Bob Meyer
1 × $31.00 -
×
 TradeWithChris - TWC Forex Trading Course
1 × $6.00
TradeWithChris - TWC Forex Trading Course
1 × $6.00 -
×
 Crystal Ball Pack PLUS bonus Live Trade By Pat Mitchell - Trick Trades
1 × $20.00
Crystal Ball Pack PLUS bonus Live Trade By Pat Mitchell - Trick Trades
1 × $20.00

Practical Introduction to Bollinger Bands 2013
$6.00
File Size: Coming soon!
Delivery Time: 1–12 hours
Media Type: Online Course
Practical Introduction to Bollinger Bands 2013
Understanding Bollinger Bands
What Are Bollinger Bands?
Bollinger Bands are a popular technical analysis tool developed by John Bollinger in the 1980s. They consist of a middle band, which is a simple moving average, and two outer bands that are standard deviations away from the middle band. These bands help traders understand volatility and identify potential buy and sell signals.
Importance in Technical Analysis
Bollinger Bands are essential for traders because they provide a visual representation of price volatility and potential market reversals. They can be applied to various asset classes, including stocks, commodities, and currencies.
Components of Bollinger Bands
The Middle Band
The middle band is typically a 20-day simple moving average (SMA). This average smooths out price data, providing a central value around which the upper and lower bands are calculated.
The Upper and Lower Bands
The upper and lower bands are usually set two standard deviations away from the middle band. These bands expand and contract based on market volatility, offering insights into price movements.
Standard Deviation
Standard deviation measures the dispersion of data from its mean. In Bollinger Bands, it helps determine the distance between the upper and lower bands and the middle band.
Calculating Bollinger Bands
Step-by-Step Calculation
- Calculate the 20-day SMA: Add the closing prices of the past 20 days and divide by 20.
- Determine the standard deviation: Calculate the standard deviation of the same 20-day period.
- Upper Band: Middle Band + (2 * Standard Deviation)
- Lower Band: Middle Band – (2 * Standard Deviation)
Example Calculation
If the 20-day SMA is $100 and the standard deviation is $5, the upper band would be $110 ($100 + (2 * $5)) and the lower band would be $90 ($100 – (2 * $5)).
Using Bollinger Bands in Trading
Identifying Trends
Bollinger Bands can help identify the direction of a trend. When the price consistently touches the upper band, it indicates an uptrend. Conversely, touching the lower band suggests a downtrend.
Overbought and Oversold Conditions
When the price moves near the upper band, the asset might be overbought, signaling a potential sell. If the price approaches the lower band, it might be oversold, indicating a potential buy.
Breakouts and Volatility
Bollinger Bands can also signal breakouts. When the bands squeeze together, it indicates low volatility and a potential breakout. A sudden widening of the bands suggests increased volatility and potential trading opportunities.
Practical Applications
Trading Strategies
Bollinger Bounce
This strategy is based on the idea that the price will revert to the mean. When the price touches the upper band, traders might consider selling. Conversely, touching the lower band might be a buy signal.
Bollinger Squeeze
The Bollinger Squeeze strategy focuses on periods of low volatility. When the bands narrow, it suggests that a breakout is imminent. Traders can prepare to enter positions in the direction of the breakout.
Combining with Other Indicators
Bollinger Bands can be combined with other technical indicators like the Relative Strength Index (RSI) or Moving Average Convergence Divergence (MACD) to enhance trading decisions.
Advantages of Bollinger Bands
Visual Clarity
Bollinger Bands provide a clear visual representation of price volatility, making it easier for traders to identify potential buy and sell signals.
Flexibility
They can be used in various markets and on different time frames, making them versatile tools for traders of all styles.
Reliability
When used correctly, Bollinger Bands can be reliable indicators of market trends and potential reversals.
Limitations of Bollinger Bands
Not a Standalone Indicator
Bollinger Bands should not be used in isolation. They are most effective when combined with other technical analysis tools.
False Signals
Like all technical indicators, Bollinger Bands can produce false signals. Traders should use them with caution and confirm signals with additional analysis.
Tips for Using Bollinger Bands
Customize Settings
Traders can adjust the period and standard deviation settings of Bollinger Bands to suit their trading style and the specific asset being traded.
Monitor Market Conditions
Regularly review market conditions and adjust your trading strategy accordingly. Bollinger Bands are more effective in certain market environments.
Practice and Patience
Successful trading with Bollinger Bands requires practice and patience. Use a demo account to test strategies before applying them to live trading.
Conclusion
Bollinger Bands are a powerful tool for traders, offering insights into market volatility and potential trading opportunities. By understanding their components, calculations, and applications, traders can effectively incorporate Bollinger Bands into their trading strategies to improve their decision-making and profitability.
FAQs
What are Bollinger Bands used for?
Bollinger Bands are used to measure market volatility and identify potential buy and sell signals based on price movements relative to the bands.
How do you calculate Bollinger Bands?
Bollinger Bands are calculated using a 20-day simple moving average and adding/subtracting two standard deviations to create the upper and lower bands.
Can Bollinger Bands be used for day trading?
Yes, Bollinger Bands can be used for day trading, as well as swing trading and long-term investing, due to their flexibility in different time frames.
What is the Bollinger Squeeze?
The Bollinger Squeeze occurs when the bands narrow, indicating low volatility and a potential breakout. It suggests that traders should prepare for a possible significant price move.
Should Bollinger Bands be used with other indicators?
Yes, Bollinger Bands are most effective when used in conjunction with other technical indicators, such as RSI or MACD, to confirm signals and enhance trading decisions.
Be the first to review “Practical Introduction to Bollinger Bands 2013”
You must be logged in to post a review.
Related products

Forex Trading
Original price was: $4,997.00.$27.00Current price is: $27.00.

Forex Trading
Original price was: $799.00.$15.00Current price is: $15.00.

Forex Trading
Original price was: $2,995.00.$31.00Current price is: $31.00.

Original price was: $450.00.$23.00Current price is: $23.00.

Forex Trading
Original price was: $499.00.$15.00Current price is: $15.00.
Original price was: $649.00.$20.00Current price is: $20.00.

Forex Trading
Original price was: $850.00.$23.00Current price is: $23.00.

Forex Trading
Original price was: $797.00.$10.00Current price is: $10.00.
Forex Trading
Original price was: $1,898.00.$10.00Current price is: $10.00.

Original price was: $197.00.$5.00Current price is: $5.00.

Forex Trading
Original price was: $550.00.$5.00Current price is: $5.00.

Forex Trading
The Complete Guide to Multiple Time Frame Analysis & Reading Price Action with Aiman Almansoori
Original price was: $1,399.00.$13.00Current price is: $13.00.

Original price was: $997.00.$8.00Current price is: $8.00.

Forex Trading
Original price was: $500.00.$5.00Current price is: $5.00.

Original price was: $139.00.$23.00Current price is: $23.00.

Forex Trading
Quantamentals – The Next Great Forefront Of Trading and Investing with Trading Markets
Original price was: $1,495.00.$8.00Current price is: $8.00.

Forex Trading
Original price was: $999.00.$15.00Current price is: $15.00.

Forex Trading
Original price was: $697.00.$5.00Current price is: $5.00.

Original price was: $999.00.$5.00Current price is: $5.00.

Original price was: $4,995.00.$15.00Current price is: $15.00.

Reviews
There are no reviews yet.