-
×
 The Master Indicator 2023 with Lance Ippolito
1 × $101.00
The Master Indicator 2023 with Lance Ippolito
1 × $101.00 -
×
 Slapped by the Invisible Hand: The Panic of 2007 with Gary Gorton
1 × $6.00
Slapped by the Invisible Hand: The Panic of 2007 with Gary Gorton
1 × $6.00 -
×
 Technical Trading: System and Design Testing Class with Jeff Bierman
1 × $6.00
Technical Trading: System and Design Testing Class with Jeff Bierman
1 × $6.00 -
×
 Better Trading with the Guppy Multiple Moving Average WorkBook with Daryl Guppy
1 × $6.00
Better Trading with the Guppy Multiple Moving Average WorkBook with Daryl Guppy
1 × $6.00 -
×
 The Handbook of Alternative Investments with Darrell R.Jobman
1 × $6.00
The Handbook of Alternative Investments with Darrell R.Jobman
1 × $6.00 -
×
 Stock Selection Course with Dave Landry
1 × $6.00
Stock Selection Course with Dave Landry
1 × $6.00 -
×
 Rapid Results Method with Russ Horn
1 × $6.00
Rapid Results Method with Russ Horn
1 × $6.00 -
×
 Foundation of Successful Trading - 2 DVDs and Bonus Gann Time Factor 2 DVDs
1 × $31.00
Foundation of Successful Trading - 2 DVDs and Bonus Gann Time Factor 2 DVDs
1 × $31.00 -
×
 Fractal Markets SFX with Tyson Bieniek
1 × $5.00
Fractal Markets SFX with Tyson Bieniek
1 × $5.00 -
×
 Smart Money Trading Course with Prosperity Academy
1 × $5.00
Smart Money Trading Course with Prosperity Academy
1 × $5.00 -
×
 The PPS Trading System with Curtis Arnold
1 × $6.00
The PPS Trading System with Curtis Arnold
1 × $6.00 -
×
 Secrets to Succesful Forex Trading Course with Jose Soto
1 × $6.00
Secrets to Succesful Forex Trading Course with Jose Soto
1 × $6.00 -
×
 Scalp Strategy and Flipping Small Accounts with Opes Trading Group
1 × $5.00
Scalp Strategy and Flipping Small Accounts with Opes Trading Group
1 × $5.00 -
×
 Cracking The Forex Code with Kevin Adams
1 × $6.00
Cracking The Forex Code with Kevin Adams
1 × $6.00 -
×
 Cotton Trading Manual with Terry Townsend
1 × $6.00
Cotton Trading Manual with Terry Townsend
1 × $6.00 -
×
 FXJake Webinars with Walter Peters
1 × $6.00
FXJake Webinars with Walter Peters
1 × $6.00 -
×
 Practical Elliott Wave Trading Strategies with Robert Miner
1 × $6.00
Practical Elliott Wave Trading Strategies with Robert Miner
1 × $6.00 -
×
 AbleTrend with John Wang & Grace Wang
1 × $6.00
AbleTrend with John Wang & Grace Wang
1 × $6.00 -
×
 How to Trade Better with Larry Williams
1 × $6.00
How to Trade Better with Larry Williams
1 × $6.00 -
×
 The Chaos Course. Cash in on Chaos with Hans Hannula
1 × $6.00
The Chaos Course. Cash in on Chaos with Hans Hannula
1 × $6.00 -
×
 Profit Before Work System with John Piper
1 × $6.00
Profit Before Work System with John Piper
1 × $6.00 -
×
 CMT Association Entire Webinars
1 × $31.00
CMT Association Entire Webinars
1 × $31.00 -
×
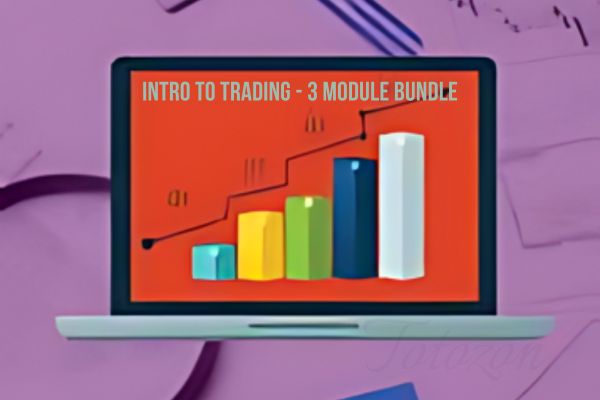 Intro To Trading - 3 Module Bundle
1 × $23.00
Intro To Trading - 3 Module Bundle
1 × $23.00 -
×
 Build A Solid Foundation For Trading Options with Corey Halliday
1 × $6.00
Build A Solid Foundation For Trading Options with Corey Halliday
1 × $6.00 -
×
 How to Make 1 Million Per Year Like Larry Williams with Larry Williams
1 × $6.00
How to Make 1 Million Per Year Like Larry Williams with Larry Williams
1 × $6.00 -
×
 CarterFX Membership with Duran Carter
1 × $23.00
CarterFX Membership with Duran Carter
1 × $23.00 -
×
 Master Time Factor & Forecasting with Mathematical Rules
1 × $6.00
Master Time Factor & Forecasting with Mathematical Rules
1 × $6.00 -
×
 SQX Mentorship with Tip Toe Hippo
1 × $23.00
SQX Mentorship with Tip Toe Hippo
1 × $23.00 -
×
 Market Neutral Strategies with Bruce I.Jacobs & Kenneth N.Levy
1 × $6.00
Market Neutral Strategies with Bruce I.Jacobs & Kenneth N.Levy
1 × $6.00 -
×
 CAT 2007 Seminar with Stephen W.Bigalow
1 × $6.00
CAT 2007 Seminar with Stephen W.Bigalow
1 × $6.00 -
×
 Prasna Tantra. Horary Astrology with Bangalore Venkata Raman
1 × $6.00
Prasna Tantra. Horary Astrology with Bangalore Venkata Raman
1 × $6.00 -
×
 Trading Mindset, and Three Steps To Profitable Trading with Bruce Banks
1 × $6.00
Trading Mindset, and Three Steps To Profitable Trading with Bruce Banks
1 × $6.00 -
×
 How to be a Sector Investor with Larry Hungerford & Steve Hungerford
1 × $4.00
How to be a Sector Investor with Larry Hungerford & Steve Hungerford
1 × $4.00 -
×
 How to Manage Profit and Cash Flow: Mining the Numbers for Gold with John Tracy & Tage Tracy
1 × $6.00
How to Manage Profit and Cash Flow: Mining the Numbers for Gold with John Tracy & Tage Tracy
1 × $6.00 -
×
 Crash Course Special Edition Set with Chris Martenson
1 × $6.00
Crash Course Special Edition Set with Chris Martenson
1 × $6.00 -
×
 Kaizen On-Demand By Candle Charts
1 × $6.00
Kaizen On-Demand By Candle Charts
1 × $6.00 -
×
 Masterclass 3.0 with RockzFX Academy
1 × $6.00
Masterclass 3.0 with RockzFX Academy
1 × $6.00 -
×
 News Profiteer System Manual & Members Area Videos with Henry Liu
1 × $6.00
News Profiteer System Manual & Members Area Videos with Henry Liu
1 × $6.00 -
×
 SE ELITE COURSE with SE TRADINGX
1 × $5.00
SE ELITE COURSE with SE TRADINGX
1 × $5.00 -
×
 Crypto Trading Academy with Cheeky Investor - Aussie Day Trader
1 × $13.00
Crypto Trading Academy with Cheeky Investor - Aussie Day Trader
1 × $13.00 -
×
 Candlestick - Training Videos (Videos 1.2 GB)
1 × $15.00
Candlestick - Training Videos (Videos 1.2 GB)
1 × $15.00 -
×
 eASCTrend Trading Manual (not including 6 trading methods) with Ablesys
1 × $6.00
eASCTrend Trading Manual (not including 6 trading methods) with Ablesys
1 × $6.00 -
×
 Technical Analysis for the Trading Professional with Constance Brown
1 × $6.00
Technical Analysis for the Trading Professional with Constance Brown
1 × $6.00 -
×
 Master The Art of Technical Analysis with Raul Gonzalez
1 × $31.00
Master The Art of Technical Analysis with Raul Gonzalez
1 × $31.00 -
×
 Equity Valuation for Analysts and Investors: A Unique Stock Valuation Tool for Financial Statement Analysis and Model-Building with James Kelleher
1 × $6.00
Equity Valuation for Analysts and Investors: A Unique Stock Valuation Tool for Financial Statement Analysis and Model-Building with James Kelleher
1 × $6.00 -
×
 Crystal Ball Pack PLUS bonus Live Trade By Pat Mitchell - Trick Trades
1 × $20.00
Crystal Ball Pack PLUS bonus Live Trade By Pat Mitchell - Trick Trades
1 × $20.00

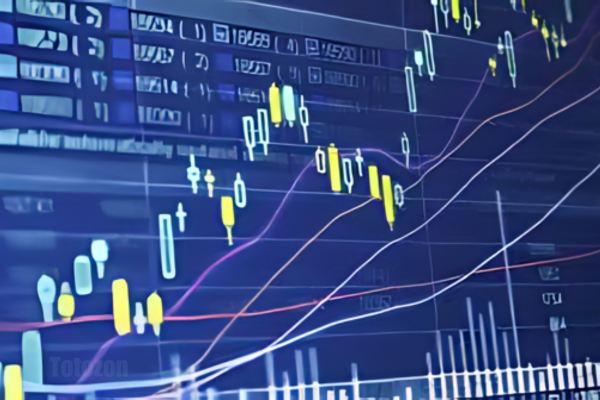
Practical Introduction to Bollinger Bands 2013
$6.00
File Size: Coming soon!
Delivery Time: 1–12 hours
Media Type: Online Course
Practical Introduction to Bollinger Bands 2013
Understanding Bollinger Bands
What Are Bollinger Bands?
Bollinger Bands are a popular technical analysis tool developed by John Bollinger in the 1980s. They consist of a middle band, which is a simple moving average, and two outer bands that are standard deviations away from the middle band. These bands help traders understand volatility and identify potential buy and sell signals.
Importance in Technical Analysis
Bollinger Bands are essential for traders because they provide a visual representation of price volatility and potential market reversals. They can be applied to various asset classes, including stocks, commodities, and currencies.
Components of Bollinger Bands
The Middle Band
The middle band is typically a 20-day simple moving average (SMA). This average smooths out price data, providing a central value around which the upper and lower bands are calculated.
The Upper and Lower Bands
The upper and lower bands are usually set two standard deviations away from the middle band. These bands expand and contract based on market volatility, offering insights into price movements.
Standard Deviation
Standard deviation measures the dispersion of data from its mean. In Bollinger Bands, it helps determine the distance between the upper and lower bands and the middle band.
Calculating Bollinger Bands
Step-by-Step Calculation
- Calculate the 20-day SMA: Add the closing prices of the past 20 days and divide by 20.
- Determine the standard deviation: Calculate the standard deviation of the same 20-day period.
- Upper Band: Middle Band + (2 * Standard Deviation)
- Lower Band: Middle Band – (2 * Standard Deviation)
Example Calculation
If the 20-day SMA is $100 and the standard deviation is $5, the upper band would be $110 ($100 + (2 * $5)) and the lower band would be $90 ($100 – (2 * $5)).
Using Bollinger Bands in Trading
Identifying Trends
Bollinger Bands can help identify the direction of a trend. When the price consistently touches the upper band, it indicates an uptrend. Conversely, touching the lower band suggests a downtrend.
Overbought and Oversold Conditions
When the price moves near the upper band, the asset might be overbought, signaling a potential sell. If the price approaches the lower band, it might be oversold, indicating a potential buy.
Breakouts and Volatility
Bollinger Bands can also signal breakouts. When the bands squeeze together, it indicates low volatility and a potential breakout. A sudden widening of the bands suggests increased volatility and potential trading opportunities.
Practical Applications
Trading Strategies
Bollinger Bounce
This strategy is based on the idea that the price will revert to the mean. When the price touches the upper band, traders might consider selling. Conversely, touching the lower band might be a buy signal.
Bollinger Squeeze
The Bollinger Squeeze strategy focuses on periods of low volatility. When the bands narrow, it suggests that a breakout is imminent. Traders can prepare to enter positions in the direction of the breakout.
Combining with Other Indicators
Bollinger Bands can be combined with other technical indicators like the Relative Strength Index (RSI) or Moving Average Convergence Divergence (MACD) to enhance trading decisions.
Advantages of Bollinger Bands
Visual Clarity
Bollinger Bands provide a clear visual representation of price volatility, making it easier for traders to identify potential buy and sell signals.
Flexibility
They can be used in various markets and on different time frames, making them versatile tools for traders of all styles.
Reliability
When used correctly, Bollinger Bands can be reliable indicators of market trends and potential reversals.
Limitations of Bollinger Bands
Not a Standalone Indicator
Bollinger Bands should not be used in isolation. They are most effective when combined with other technical analysis tools.
False Signals
Like all technical indicators, Bollinger Bands can produce false signals. Traders should use them with caution and confirm signals with additional analysis.
Tips for Using Bollinger Bands
Customize Settings
Traders can adjust the period and standard deviation settings of Bollinger Bands to suit their trading style and the specific asset being traded.
Monitor Market Conditions
Regularly review market conditions and adjust your trading strategy accordingly. Bollinger Bands are more effective in certain market environments.
Practice and Patience
Successful trading with Bollinger Bands requires practice and patience. Use a demo account to test strategies before applying them to live trading.
Conclusion
Bollinger Bands are a powerful tool for traders, offering insights into market volatility and potential trading opportunities. By understanding their components, calculations, and applications, traders can effectively incorporate Bollinger Bands into their trading strategies to improve their decision-making and profitability.
FAQs
What are Bollinger Bands used for?
Bollinger Bands are used to measure market volatility and identify potential buy and sell signals based on price movements relative to the bands.
How do you calculate Bollinger Bands?
Bollinger Bands are calculated using a 20-day simple moving average and adding/subtracting two standard deviations to create the upper and lower bands.
Can Bollinger Bands be used for day trading?
Yes, Bollinger Bands can be used for day trading, as well as swing trading and long-term investing, due to their flexibility in different time frames.
What is the Bollinger Squeeze?
The Bollinger Squeeze occurs when the bands narrow, indicating low volatility and a potential breakout. It suggests that traders should prepare for a possible significant price move.
Should Bollinger Bands be used with other indicators?
Yes, Bollinger Bands are most effective when used in conjunction with other technical indicators, such as RSI or MACD, to confirm signals and enhance trading decisions.
Be the first to review “Practical Introduction to Bollinger Bands 2013”
You must be logged in to post a review.
Related products
Forex Trading
Original price was: $1,898.00.$10.00Current price is: $10.00.

Original price was: $139.00.$23.00Current price is: $23.00.

Original price was: $497.00.$31.00Current price is: $31.00.

Forex Trading
Original price was: $500.00.$5.00Current price is: $5.00.

Original price was: $310.00.$23.00Current price is: $23.00.

Forex Trading
Original price was: $2,995.00.$31.00Current price is: $31.00.

Forex Trading
Original price was: $397.00.$31.00Current price is: $31.00.
Original price was: $649.00.$20.00Current price is: $20.00.
Original price was: $997.00.$13.00Current price is: $13.00.

Forex Trading
Original price was: $499.00.$15.00Current price is: $15.00.

Forex Trading
Original price was: $799.00.$15.00Current price is: $15.00.

Forex Trading
Original price was: $125.00.$17.00Current price is: $17.00.

Original price was: $895.00.$15.00Current price is: $15.00.

Original price was: $1,800.00.$54.00Current price is: $54.00.

Forex Trading
Original price was: $2,000.00.$23.00Current price is: $23.00.

Forex Trading
Quantamentals – The Next Great Forefront Of Trading and Investing with Trading Markets
Original price was: $1,495.00.$8.00Current price is: $8.00.

Forex Trading
Original price was: $999.00.$15.00Current price is: $15.00.
Original price was: $999.00.$5.00Current price is: $5.00.

Forex Trading
Original price was: $239.00.$8.00Current price is: $8.00.

Forex Trading
Original price was: $550.00.$5.00Current price is: $5.00.

Reviews
There are no reviews yet.