-
×
 Options Trading Accelerator with Base Camp Trading
1 × $23.00
Options Trading Accelerator with Base Camp Trading
1 × $23.00 -
×
 Sea Lanes & Pipelines with Bernard D.Cole
1 × $6.00
Sea Lanes & Pipelines with Bernard D.Cole
1 × $6.00 -
×
 How to Overlay Technical Indicators with Keith Raphael
1 × $6.00
How to Overlay Technical Indicators with Keith Raphael
1 × $6.00 -
×
 ICT Mastery with Casper SMC
1 × $14.00
ICT Mastery with Casper SMC
1 × $14.00 -
×
 How to Value & Sell your Business with Andrew Heslop
1 × $6.00
How to Value & Sell your Business with Andrew Heslop
1 × $6.00 -
×
 Price Action Manual (2nd Ed.) with Bruce Gilmore
1 × $6.00
Price Action Manual (2nd Ed.) with Bruce Gilmore
1 × $6.00 -
×
 Intro To Trading - 3 Module Bundle
1 × $23.00
Intro To Trading - 3 Module Bundle
1 × $23.00 -
×
 The Loyalty Effect with Frederick Reichheld
1 × $6.00
The Loyalty Effect with Frederick Reichheld
1 × $6.00 -
×
 Pattern, Price & Time: Using Gann Theory in Trading Systems (1st Edition) with James Hyerczyk
1 × $6.00
Pattern, Price & Time: Using Gann Theory in Trading Systems (1st Edition) with James Hyerczyk
1 × $6.00 -
×
 Principles of Artificial Neural Networks (2nd Ed.) with Daniel Graupe
1 × $6.00
Principles of Artificial Neural Networks (2nd Ed.) with Daniel Graupe
1 × $6.00 -
×
 Neural Networks in Trading with Dr. Ernest P. Chan
1 × $31.00
Neural Networks in Trading with Dr. Ernest P. Chan
1 × $31.00 -
×
 The Best of the Professional Traders Journal. Market Timing with Larry Connors
1 × $6.00
The Best of the Professional Traders Journal. Market Timing with Larry Connors
1 × $6.00 -
×
 Active Investment Management: Finding and Harnessing Investment Skill with Charles Jackson
1 × $6.00
Active Investment Management: Finding and Harnessing Investment Skill with Charles Jackson
1 × $6.00 -
×
 Intra-day Trading Strategies. Proven Steps to Trading Profits
1 × $6.00
Intra-day Trading Strategies. Proven Steps to Trading Profits
1 × $6.00 -
×
 Pattern Trader Pro with ForexStore
1 × $6.00
Pattern Trader Pro with ForexStore
1 × $6.00 -
×
 March 2023 Intensive Live Trading Event with Apteros Trading
1 × $5.00
March 2023 Intensive Live Trading Event with Apteros Trading
1 × $5.00 -
×
 Project Manager’s Spotlight on Risk Management with Kim Heldman
1 × $5.00
Project Manager’s Spotlight on Risk Management with Kim Heldman
1 × $5.00 -
×
 Newtonian Trading Strategy Video Course with Fractal Flow Pro
1 × $6.00
Newtonian Trading Strategy Video Course with Fractal Flow Pro
1 × $6.00 -
×
 Manage the Greeks & the Risk of ODTE & 1-4 day Trades for October 2023 with Sheridan Options Mentoring
1 × $85.00
Manage the Greeks & the Risk of ODTE & 1-4 day Trades for October 2023 with Sheridan Options Mentoring
1 × $85.00 -
×
 Handbook for Enviroment Risk Decision Making with C.Richard Cothern
1 × $6.00
Handbook for Enviroment Risk Decision Making with C.Richard Cothern
1 × $6.00 -
×
 Hedge Funds: Insights in Performance Measurement, Risk Analysis, and Portfolio Allocation (1st Edition) - Greg Gregoriou, Georges Hübner, Nicolas Papageorgiou & Fabrice Rouah
1 × $6.00
Hedge Funds: Insights in Performance Measurement, Risk Analysis, and Portfolio Allocation (1st Edition) - Greg Gregoriou, Georges Hübner, Nicolas Papageorgiou & Fabrice Rouah
1 × $6.00 -
×
 Swift Trader, Perfecting the Art of DayTrading with Charles Kim
1 × $6.00
Swift Trader, Perfecting the Art of DayTrading with Charles Kim
1 × $6.00 -
×
 Market Energy Trader with Top Trade Tools
1 × $5.00
Market Energy Trader with Top Trade Tools
1 × $5.00 -
×
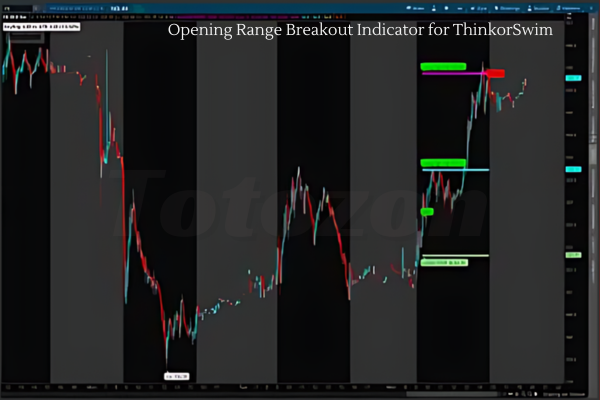 Opening Range Breakout Indicator for ThinkorSwim
1 × $6.00
Opening Range Breakout Indicator for ThinkorSwim
1 × $6.00 -
×
 Order Flow Mastery Course with OrderFlowForex
1 × $6.00
Order Flow Mastery Course with OrderFlowForex
1 × $6.00 -
×
 Forex Trading Course with Mike Norman
1 × $17.00
Forex Trading Course with Mike Norman
1 × $17.00 -
×
 The Crash of 1997 (Article) with Hans Hannula
1 × $6.00
The Crash of 1997 (Article) with Hans Hannula
1 × $6.00 -
×
 ICT Prodigy Trading Course – $650K in Payouts with Alex Solignani
1 × $15.00
ICT Prodigy Trading Course – $650K in Payouts with Alex Solignani
1 × $15.00 -
×
 Phantom of the Pit BY Art Simpson
1 × $6.00
Phantom of the Pit BY Art Simpson
1 × $6.00 -
×
 Pricing of Bond Options with Detlef Repplinger
1 × $6.00
Pricing of Bond Options with Detlef Repplinger
1 × $6.00 -
×
 Quantamentals - The Next Great Forefront Of Trading and Investing with Trading Markets
1 × $8.00
Quantamentals - The Next Great Forefront Of Trading and Investing with Trading Markets
1 × $8.00 -
×
 OFA - Intensive Boot Camp 5 Day Course
1 × $6.00
OFA - Intensive Boot Camp 5 Day Course
1 × $6.00 -
×
 Investing In KLSE Stocks and Futures With Japanese Candlestick with Fred Tam
1 × $6.00
Investing In KLSE Stocks and Futures With Japanese Candlestick with Fred Tam
1 × $6.00 -
×
 Sun Tzu and the Art of War for Traders with Dean Lundell
1 × $6.00
Sun Tzu and the Art of War for Traders with Dean Lundell
1 × $6.00 -
×
 Master Forex Fundamentals
1 × $15.00
Master Forex Fundamentals
1 × $15.00 -
×
 How To Be a Profitable Forex Trader with Corey Halliday
1 × $6.00
How To Be a Profitable Forex Trader with Corey Halliday
1 × $6.00 -
×
 Pattern Cycles with Alan Farley
1 × $6.00
Pattern Cycles with Alan Farley
1 × $6.00 -
×
 Gann Masters II with Hallikers Inc
1 × $6.00
Gann Masters II with Hallikers Inc
1 × $6.00 -
×
 LBFX Academy Training Course
1 × $5.00
LBFX Academy Training Course
1 × $5.00 -
×
 Crypto Trading Cyber Security for Bitcoin & Altcoin Holders with Zlatin Georgiev
1 × $5.00
Crypto Trading Cyber Security for Bitcoin & Altcoin Holders with Zlatin Georgiev
1 × $5.00 -
×
 Math Trading Course 2023
1 × $34.00
Math Trading Course 2023
1 × $34.00 -
×
 SRs Trend Rider 2.0
1 × $6.00
SRs Trend Rider 2.0
1 × $6.00 -
×
 Options, Futures & Other Derivatives (5th Ed.)
1 × $6.00
Options, Futures & Other Derivatives (5th Ed.)
1 × $6.00 -
×
 Right Line Trading IndicatorSuite (May 2015)
1 × $31.00
Right Line Trading IndicatorSuite (May 2015)
1 × $31.00 -
×
 Practical Approach to Ninjatrader 8 Platform with Rajandran R
1 × $6.00
Practical Approach to Ninjatrader 8 Platform with Rajandran R
1 × $6.00 -
×
 How To Write High Converting Copy with Tej Dosa
1 × $6.00
How To Write High Converting Copy with Tej Dosa
1 × $6.00 -
×
 Making a 2021 Trading Plan and Trading it for 3 Weeks with Sheridan Options Mentoring
1 × $39.00
Making a 2021 Trading Plan and Trading it for 3 Weeks with Sheridan Options Mentoring
1 × $39.00 -
×
 The MMXM Trader – Personal Approach
1 × $5.00
The MMXM Trader – Personal Approach
1 × $5.00 -
×
 Rockwell Trading - Money Management - 2 DVDs
1 × $6.00
Rockwell Trading - Money Management - 2 DVDs
1 × $6.00 -
×
 Lazy Emini Trader Master Class Course - David Frost
1 × $10.00
Lazy Emini Trader Master Class Course - David Frost
1 × $10.00 -
×
 Orderflows - The Imbalance Course
1 × $8.00
Orderflows - The Imbalance Course
1 × $8.00 -
×
 W. D Gann 's Square Of 9 Applied To Modern Markets with Sean Avidar - Hexatrade350
1 × $23.00
W. D Gann 's Square Of 9 Applied To Modern Markets with Sean Avidar - Hexatrade350
1 × $23.00

Practical Introduction to Bollinger Bands 2013
$6.00
File Size: Coming soon!
Delivery Time: 1–12 hours
Media Type: Online Course
Practical Introduction to Bollinger Bands 2013
Understanding Bollinger Bands
What Are Bollinger Bands?
Bollinger Bands are a popular technical analysis tool developed by John Bollinger in the 1980s. They consist of a middle band, which is a simple moving average, and two outer bands that are standard deviations away from the middle band. These bands help traders understand volatility and identify potential buy and sell signals.
Importance in Technical Analysis
Bollinger Bands are essential for traders because they provide a visual representation of price volatility and potential market reversals. They can be applied to various asset classes, including stocks, commodities, and currencies.
Components of Bollinger Bands
The Middle Band
The middle band is typically a 20-day simple moving average (SMA). This average smooths out price data, providing a central value around which the upper and lower bands are calculated.
The Upper and Lower Bands
The upper and lower bands are usually set two standard deviations away from the middle band. These bands expand and contract based on market volatility, offering insights into price movements.
Standard Deviation
Standard deviation measures the dispersion of data from its mean. In Bollinger Bands, it helps determine the distance between the upper and lower bands and the middle band.
Calculating Bollinger Bands
Step-by-Step Calculation
- Calculate the 20-day SMA: Add the closing prices of the past 20 days and divide by 20.
- Determine the standard deviation: Calculate the standard deviation of the same 20-day period.
- Upper Band: Middle Band + (2 * Standard Deviation)
- Lower Band: Middle Band – (2 * Standard Deviation)
Example Calculation
If the 20-day SMA is $100 and the standard deviation is $5, the upper band would be $110 ($100 + (2 * $5)) and the lower band would be $90 ($100 – (2 * $5)).
Using Bollinger Bands in Trading
Identifying Trends
Bollinger Bands can help identify the direction of a trend. When the price consistently touches the upper band, it indicates an uptrend. Conversely, touching the lower band suggests a downtrend.
Overbought and Oversold Conditions
When the price moves near the upper band, the asset might be overbought, signaling a potential sell. If the price approaches the lower band, it might be oversold, indicating a potential buy.
Breakouts and Volatility
Bollinger Bands can also signal breakouts. When the bands squeeze together, it indicates low volatility and a potential breakout. A sudden widening of the bands suggests increased volatility and potential trading opportunities.
Practical Applications
Trading Strategies
Bollinger Bounce
This strategy is based on the idea that the price will revert to the mean. When the price touches the upper band, traders might consider selling. Conversely, touching the lower band might be a buy signal.
Bollinger Squeeze
The Bollinger Squeeze strategy focuses on periods of low volatility. When the bands narrow, it suggests that a breakout is imminent. Traders can prepare to enter positions in the direction of the breakout.
Combining with Other Indicators
Bollinger Bands can be combined with other technical indicators like the Relative Strength Index (RSI) or Moving Average Convergence Divergence (MACD) to enhance trading decisions.
Advantages of Bollinger Bands
Visual Clarity
Bollinger Bands provide a clear visual representation of price volatility, making it easier for traders to identify potential buy and sell signals.
Flexibility
They can be used in various markets and on different time frames, making them versatile tools for traders of all styles.
Reliability
When used correctly, Bollinger Bands can be reliable indicators of market trends and potential reversals.
Limitations of Bollinger Bands
Not a Standalone Indicator
Bollinger Bands should not be used in isolation. They are most effective when combined with other technical analysis tools.
False Signals
Like all technical indicators, Bollinger Bands can produce false signals. Traders should use them with caution and confirm signals with additional analysis.
Tips for Using Bollinger Bands
Customize Settings
Traders can adjust the period and standard deviation settings of Bollinger Bands to suit their trading style and the specific asset being traded.
Monitor Market Conditions
Regularly review market conditions and adjust your trading strategy accordingly. Bollinger Bands are more effective in certain market environments.
Practice and Patience
Successful trading with Bollinger Bands requires practice and patience. Use a demo account to test strategies before applying them to live trading.
Conclusion
Bollinger Bands are a powerful tool for traders, offering insights into market volatility and potential trading opportunities. By understanding their components, calculations, and applications, traders can effectively incorporate Bollinger Bands into their trading strategies to improve their decision-making and profitability.
FAQs
What are Bollinger Bands used for?
Bollinger Bands are used to measure market volatility and identify potential buy and sell signals based on price movements relative to the bands.
How do you calculate Bollinger Bands?
Bollinger Bands are calculated using a 20-day simple moving average and adding/subtracting two standard deviations to create the upper and lower bands.
Can Bollinger Bands be used for day trading?
Yes, Bollinger Bands can be used for day trading, as well as swing trading and long-term investing, due to their flexibility in different time frames.
What is the Bollinger Squeeze?
The Bollinger Squeeze occurs when the bands narrow, indicating low volatility and a potential breakout. It suggests that traders should prepare for a possible significant price move.
Should Bollinger Bands be used with other indicators?
Yes, Bollinger Bands are most effective when used in conjunction with other technical indicators, such as RSI or MACD, to confirm signals and enhance trading decisions.
Be the first to review “Practical Introduction to Bollinger Bands 2013”
You must be logged in to post a review.
Related products

Forex Trading
Original price was: $1,098.00.$39.00Current price is: $39.00.

Original price was: $997.00.$13.00Current price is: $13.00.

Original price was: $997.00.$8.00Current price is: $8.00.
Forex Trading
Quantamentals – The Next Great Forefront Of Trading and Investing with Trading Markets
Original price was: $1,495.00.$8.00Current price is: $8.00.

Original price was: $999.00.$5.00Current price is: $5.00.

Original price was: $1,849.00.$15.00Current price is: $15.00.

Forex Trading
Original price was: $249.00.$15.00Current price is: $15.00.

Original price was: $895.00.$15.00Current price is: $15.00.

Original price was: $310.00.$23.00Current price is: $23.00.

Original price was: $1,200.00.$23.00Current price is: $23.00.

Forex Trading
Original price was: $2,995.00.$31.00Current price is: $31.00.

Original price was: $1,800.00.$54.00Current price is: $54.00.

Forex Trading
Original price was: $850.00.$23.00Current price is: $23.00.

Forex Trading
Original price was: $125.00.$17.00Current price is: $17.00.
Forex Trading
Original price was: $1,898.00.$10.00Current price is: $10.00.

Forex Trading
Original price was: $499.00.$15.00Current price is: $15.00.

Forex Trading
Original price was: $500.00.$5.00Current price is: $5.00.

Forex Trading
Original price was: $4,997.00.$27.00Current price is: $27.00.

Original price was: $497.00.$11.00Current price is: $11.00.

Forex Trading
Original price was: $797.00.$10.00Current price is: $10.00.

Reviews
There are no reviews yet.