-
×
 Professional Trader Course
1 × $5.00
Professional Trader Course
1 × $5.00 -
×
 Sacredscience - W.F.Whitehead – Occultism Simplified
1 × $6.00
Sacredscience - W.F.Whitehead – Occultism Simplified
1 × $6.00 -
×
 Investment Blunders with John Nofsinger
1 × $6.00
Investment Blunders with John Nofsinger
1 × $6.00 -
×
 X-Factor Day-Trading
1 × $5.00
X-Factor Day-Trading
1 × $5.00 -
×
 CAT 2007 Seminar with Stephen W.Bigalow
1 × $6.00
CAT 2007 Seminar with Stephen W.Bigalow
1 × $6.00 -
×
 Confidence to Hypnotize
1 × $6.00
Confidence to Hypnotize
1 × $6.00 -
×
 Forex Trading for Newbies Complete Course with Chuck Low
1 × $6.00
Forex Trading for Newbies Complete Course with Chuck Low
1 × $6.00 -
×
 Futures Commodity Trading with G. Scott Martin
1 × $6.00
Futures Commodity Trading with G. Scott Martin
1 × $6.00 -
×
 George Bayer Soft 1.02
1 × $6.00
George Bayer Soft 1.02
1 × $6.00 -
×
 Future DayTrading (German)
1 × $6.00
Future DayTrading (German)
1 × $6.00 -
×
 Debt Capital Markets in China with Jian Gao
1 × $6.00
Debt Capital Markets in China with Jian Gao
1 × $6.00 -
×
 Sure Thing Stock Investing with Larry Williams
1 × $6.00
Sure Thing Stock Investing with Larry Williams
1 × $6.00 -
×
 You can be a Stock Market Genious with Joel Greenblaat
1 × $6.00
You can be a Stock Market Genious with Joel Greenblaat
1 × $6.00 -
×
 Come Into My Trading Room: A Complete Guide to Trading with Alexander Elder
1 × $6.00
Come Into My Trading Room: A Complete Guide to Trading with Alexander Elder
1 × $6.00 -
×
 TOP Momentum Bundle with Top Trade Tools
1 × $62.00
TOP Momentum Bundle with Top Trade Tools
1 × $62.00 -
×
 Online Course - Why Wave Analysis Belongs in Every Trader's Toolbox with Jeffrey Kennedy - Elliott Wave
1 × $15.00
Online Course - Why Wave Analysis Belongs in Every Trader's Toolbox with Jeffrey Kennedy - Elliott Wave
1 × $15.00 -
×
 Day Trader Course
1 × $6.00
Day Trader Course
1 × $6.00 -
×
 ProfileTraders - 5 course bundle
1 × $23.00
ProfileTraders - 5 course bundle
1 × $23.00 -
×
 The Internet Trading Course with Alpesh Patel
1 × $6.00
The Internet Trading Course with Alpesh Patel
1 × $6.00 -
×
 Profitable DayTrading with Precision - George Angell
1 × $6.00
Profitable DayTrading with Precision - George Angell
1 × $6.00 -
×
 Gann Masters II with Hallikers Inc
1 × $6.00
Gann Masters II with Hallikers Inc
1 × $6.00 -
×
 The New Electronic Traders with Jonathan R.Aspartore
1 × $6.00
The New Electronic Traders with Jonathan R.Aspartore
1 × $6.00 -
×
 High Probability Option Trading - Seasonal Straddles
1 × $6.00
High Probability Option Trading - Seasonal Straddles
1 × $6.00 -
×
 Consistent Intraday Strategies and Setups Class with Don Kaufman
1 × $6.00
Consistent Intraday Strategies and Setups Class with Don Kaufman
1 × $6.00 -
×
 EasyLanguage Home Study Course PDF Book + CD
1 × $6.00
EasyLanguage Home Study Course PDF Book + CD
1 × $6.00 -
×
 The New Science of Asset Allocation with Thomas Schneeweis
1 × $6.00
The New Science of Asset Allocation with Thomas Schneeweis
1 × $6.00 -
×
 Investing in stocks: Avoid stock market loss
1 × $15.00
Investing in stocks: Avoid stock market loss
1 × $15.00 -
×
 Rule Based Price Action with Trader Divergent
1 × $5.00
Rule Based Price Action with Trader Divergent
1 × $5.00 -
×
 Forex Courses Collection
1 × $55.00
Forex Courses Collection
1 × $55.00 -
×
 A Seminar On Ocean Theory Home Study Trading Course with Pat Raffalovich
1 × $6.00
A Seminar On Ocean Theory Home Study Trading Course with Pat Raffalovich
1 × $6.00 -
×
 Volatility and Timing with Jay Kaeppel – The Option Trader’s Guide to Probability
1 × $6.00
Volatility and Timing with Jay Kaeppel – The Option Trader’s Guide to Probability
1 × $6.00 -
×
 Gap Trading for Stock and Options Traders with Damon Verial
1 × $6.00
Gap Trading for Stock and Options Traders with Damon Verial
1 × $6.00 -
×
 The Trading Blueprint with Brad Goh - The Trading Geek
1 × $5.00
The Trading Blueprint with Brad Goh - The Trading Geek
1 × $5.00 -
×
 Contrarian Investing with Anthony M.Gallea, William Patalon
1 × $6.00
Contrarian Investing with Anthony M.Gallea, William Patalon
1 × $6.00 -
×
 Onyx Platinum Trading Accelerator 2.0 with Nick Deflorio
1 × $6.00
Onyx Platinum Trading Accelerator 2.0 with Nick Deflorio
1 × $6.00 -
×
 FOUS4 with Cameron Fous
1 × $5.00
FOUS4 with Cameron Fous
1 × $5.00 -
×
 Option Alpha Signals
1 × $15.00
Option Alpha Signals
1 × $15.00 -
×
 Currency Trading System 2003 with Peter Bain
1 × $6.00
Currency Trading System 2003 with Peter Bain
1 × $6.00 -
×
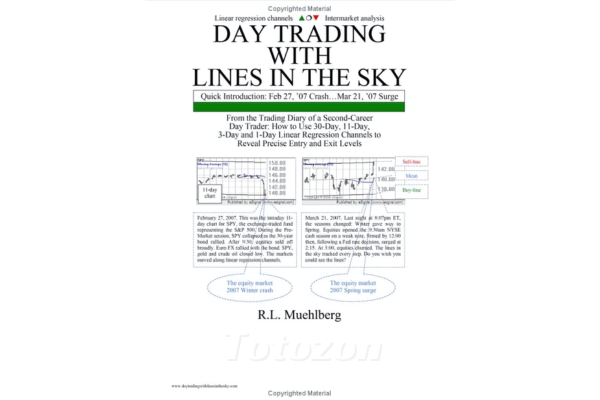 Day Trading with Lines in the Sky By R.L.Muehlberg
1 × $6.00
Day Trading with Lines in the Sky By R.L.Muehlberg
1 × $6.00 -
×
 How to Pick Hot Reverse Merger Penny Stocks with John Lux
1 × $5.00
How to Pick Hot Reverse Merger Penny Stocks with John Lux
1 × $5.00 -
×
 Profit in the Futures Markets! with Jack Bernstein
1 × $6.00
Profit in the Futures Markets! with Jack Bernstein
1 × $6.00 -
×
 The Best (Public) Trading Methods I’ve Found for Futures & Equities with Perry J.Kaufman
1 × $6.00
The Best (Public) Trading Methods I’ve Found for Futures & Equities with Perry J.Kaufman
1 × $6.00 -
×
 The Mathematics of Money Management. Risk Analysis Techniques for Traders
1 × $6.00
The Mathematics of Money Management. Risk Analysis Techniques for Traders
1 × $6.00 -
×
 Managing By The Greeks (6 Classes) Sept 2010 [9 Videos(mp4) 11 docs(pdf)] by Dan Sheridan
1 × $6.00
Managing By The Greeks (6 Classes) Sept 2010 [9 Videos(mp4) 11 docs(pdf)] by Dan Sheridan
1 × $6.00 -
×
 Gann Wheel 1.2.15 (globalviewtech.com)
1 × $6.00
Gann Wheel 1.2.15 (globalviewtech.com)
1 × $6.00 -
×
 How to Trade a Vertical Market
1 × $93.00
How to Trade a Vertical Market
1 × $93.00 -
×
 MQ Gravity Lines with Base Camp Trading
1 × $54.00
MQ Gravity Lines with Base Camp Trading
1 × $54.00 -
×
 CFA Level 3- Examination Morning Session – Essay (2004)
1 × $6.00
CFA Level 3- Examination Morning Session – Essay (2004)
1 × $6.00 -
×
 POS+ Hindi 30 Days Subscription with Surjeetkakkar
1 × $62.00
POS+ Hindi 30 Days Subscription with Surjeetkakkar
1 × $62.00 -
×
 The Box Strategy with Blue Capital Academy
1 × $23.00
The Box Strategy with Blue Capital Academy
1 × $23.00 -
×
 SQX Mentorship with Tip Toe Hippo
1 × $23.00
SQX Mentorship with Tip Toe Hippo
1 × $23.00 -
×
 F.A.M.E. Home Study Course with Doug Sutton
1 × $6.00
F.A.M.E. Home Study Course with Doug Sutton
1 × $6.00 -
×
 Mathematical Problems in Image Processing with Charles E.Chidume
1 × $6.00
Mathematical Problems in Image Processing with Charles E.Chidume
1 × $6.00 -
×
 Technical Analysis for Short-Term Traders
1 × $6.00
Technical Analysis for Short-Term Traders
1 × $6.00 -
×
 Fibsdontlie - Fibs Don’t Lie Advanced Course
1 × $15.00
Fibsdontlie - Fibs Don’t Lie Advanced Course
1 × $15.00 -
×
 TIMfundamentals with Timothy Sykes
1 × $5.00
TIMfundamentals with Timothy Sykes
1 × $5.00 -
×
 Forex Patterns and Probabilities: Trading Strategies for Trending and Range-Bound Markets with Ed Ponsi
1 × $6.00
Forex Patterns and Probabilities: Trading Strategies for Trending and Range-Bound Markets with Ed Ponsi
1 × $6.00 -
×
 The Complete Guide to Multiple Time Frame Analysis & Reading Price Action with Aiman Almansoori
1 × $13.00
The Complete Guide to Multiple Time Frame Analysis & Reading Price Action with Aiman Almansoori
1 × $13.00

Practical Introduction to Bollinger Bands 2013
$6.00
File Size: Coming soon!
Delivery Time: 1–12 hours
Media Type: Online Course
Practical Introduction to Bollinger Bands 2013
Understanding Bollinger Bands
What Are Bollinger Bands?
Bollinger Bands are a popular technical analysis tool developed by John Bollinger in the 1980s. They consist of a middle band, which is a simple moving average, and two outer bands that are standard deviations away from the middle band. These bands help traders understand volatility and identify potential buy and sell signals.
Importance in Technical Analysis
Bollinger Bands are essential for traders because they provide a visual representation of price volatility and potential market reversals. They can be applied to various asset classes, including stocks, commodities, and currencies.
Components of Bollinger Bands
The Middle Band
The middle band is typically a 20-day simple moving average (SMA). This average smooths out price data, providing a central value around which the upper and lower bands are calculated.
The Upper and Lower Bands
The upper and lower bands are usually set two standard deviations away from the middle band. These bands expand and contract based on market volatility, offering insights into price movements.
Standard Deviation
Standard deviation measures the dispersion of data from its mean. In Bollinger Bands, it helps determine the distance between the upper and lower bands and the middle band.
Calculating Bollinger Bands
Step-by-Step Calculation
- Calculate the 20-day SMA: Add the closing prices of the past 20 days and divide by 20.
- Determine the standard deviation: Calculate the standard deviation of the same 20-day period.
- Upper Band: Middle Band + (2 * Standard Deviation)
- Lower Band: Middle Band – (2 * Standard Deviation)
Example Calculation
If the 20-day SMA is $100 and the standard deviation is $5, the upper band would be $110 ($100 + (2 * $5)) and the lower band would be $90 ($100 – (2 * $5)).
Using Bollinger Bands in Trading
Identifying Trends
Bollinger Bands can help identify the direction of a trend. When the price consistently touches the upper band, it indicates an uptrend. Conversely, touching the lower band suggests a downtrend.
Overbought and Oversold Conditions
When the price moves near the upper band, the asset might be overbought, signaling a potential sell. If the price approaches the lower band, it might be oversold, indicating a potential buy.
Breakouts and Volatility
Bollinger Bands can also signal breakouts. When the bands squeeze together, it indicates low volatility and a potential breakout. A sudden widening of the bands suggests increased volatility and potential trading opportunities.
Practical Applications
Trading Strategies
Bollinger Bounce
This strategy is based on the idea that the price will revert to the mean. When the price touches the upper band, traders might consider selling. Conversely, touching the lower band might be a buy signal.
Bollinger Squeeze
The Bollinger Squeeze strategy focuses on periods of low volatility. When the bands narrow, it suggests that a breakout is imminent. Traders can prepare to enter positions in the direction of the breakout.
Combining with Other Indicators
Bollinger Bands can be combined with other technical indicators like the Relative Strength Index (RSI) or Moving Average Convergence Divergence (MACD) to enhance trading decisions.
Advantages of Bollinger Bands
Visual Clarity
Bollinger Bands provide a clear visual representation of price volatility, making it easier for traders to identify potential buy and sell signals.
Flexibility
They can be used in various markets and on different time frames, making them versatile tools for traders of all styles.
Reliability
When used correctly, Bollinger Bands can be reliable indicators of market trends and potential reversals.
Limitations of Bollinger Bands
Not a Standalone Indicator
Bollinger Bands should not be used in isolation. They are most effective when combined with other technical analysis tools.
False Signals
Like all technical indicators, Bollinger Bands can produce false signals. Traders should use them with caution and confirm signals with additional analysis.
Tips for Using Bollinger Bands
Customize Settings
Traders can adjust the period and standard deviation settings of Bollinger Bands to suit their trading style and the specific asset being traded.
Monitor Market Conditions
Regularly review market conditions and adjust your trading strategy accordingly. Bollinger Bands are more effective in certain market environments.
Practice and Patience
Successful trading with Bollinger Bands requires practice and patience. Use a demo account to test strategies before applying them to live trading.
Conclusion
Bollinger Bands are a powerful tool for traders, offering insights into market volatility and potential trading opportunities. By understanding their components, calculations, and applications, traders can effectively incorporate Bollinger Bands into their trading strategies to improve their decision-making and profitability.
FAQs
What are Bollinger Bands used for?
Bollinger Bands are used to measure market volatility and identify potential buy and sell signals based on price movements relative to the bands.
How do you calculate Bollinger Bands?
Bollinger Bands are calculated using a 20-day simple moving average and adding/subtracting two standard deviations to create the upper and lower bands.
Can Bollinger Bands be used for day trading?
Yes, Bollinger Bands can be used for day trading, as well as swing trading and long-term investing, due to their flexibility in different time frames.
What is the Bollinger Squeeze?
The Bollinger Squeeze occurs when the bands narrow, indicating low volatility and a potential breakout. It suggests that traders should prepare for a possible significant price move.
Should Bollinger Bands be used with other indicators?
Yes, Bollinger Bands are most effective when used in conjunction with other technical indicators, such as RSI or MACD, to confirm signals and enhance trading decisions.
Be the first to review “Practical Introduction to Bollinger Bands 2013”
You must be logged in to post a review.
Related products

Forex Trading
Original price was: $999.00.$15.00Current price is: $15.00.

Original price was: $1,200.00.$23.00Current price is: $23.00.
Forex Trading
Original price was: $697.00.$5.00Current price is: $5.00.
Forex Trading
The Complete Guide to Multiple Time Frame Analysis & Reading Price Action with Aiman Almansoori
Original price was: $1,399.00.$13.00Current price is: $13.00.

Original price was: $299.00.$8.00Current price is: $8.00.

Forex Trading
Original price was: $550.00.$5.00Current price is: $5.00.

Forex Trading
Original price was: $2,995.00.$31.00Current price is: $31.00.

Original price was: $450.00.$23.00Current price is: $23.00.

Forex Trading
Original price was: $249.00.$15.00Current price is: $15.00.

Forex Trading
Original price was: $4,997.00.$27.00Current price is: $27.00.

Original price was: $2,120.00.$15.00Current price is: $15.00.

Forex Trading
Original price was: $397.00.$31.00Current price is: $31.00.

Original price was: $997.00.$13.00Current price is: $13.00.

Original price was: $497.00.$11.00Current price is: $11.00.

Forex Trading
Original price was: $799.00.$15.00Current price is: $15.00.

Original price was: $1,800.00.$54.00Current price is: $54.00.

Original price was: $197.00.$5.00Current price is: $5.00.

Original price was: $310.00.$23.00Current price is: $23.00.

Original price was: $799.00.$15.00Current price is: $15.00.

Original price was: $497.00.$31.00Current price is: $31.00.

Reviews
There are no reviews yet.