-
×
 Build A Solid Foundation For Trading Options with Corey Halliday
1 × $6.00
Build A Solid Foundation For Trading Options with Corey Halliday
1 × $6.00 -
×
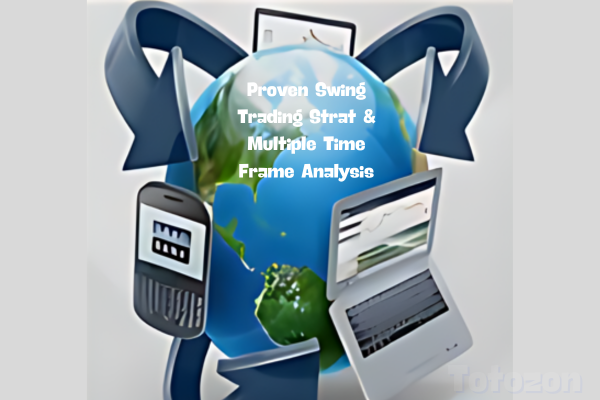 Proven Swing Trading Strat & Multiple Time Frame Analysis - Robert Krausz & Thom Hartle
1 × $6.00
Proven Swing Trading Strat & Multiple Time Frame Analysis - Robert Krausz & Thom Hartle
1 × $6.00 -
×
 Trading Trainer - 6 Percent Protocol
1 × $39.00
Trading Trainer - 6 Percent Protocol
1 × $39.00 -
×
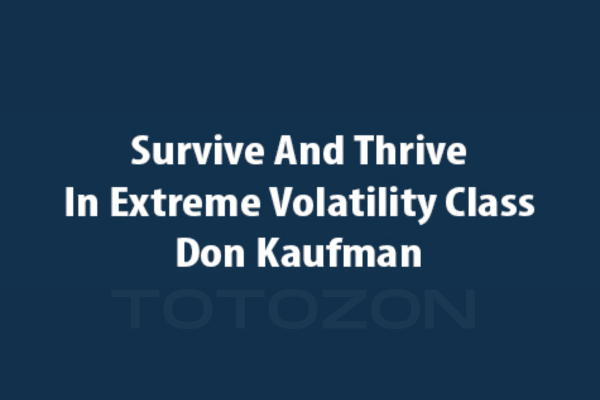 Survive and Thrive in Extreme Volatility Class with Don Kaufman
1 × $6.00
Survive and Thrive in Extreme Volatility Class with Don Kaufman
1 × $6.00 -
×
 Natural Language Processing in Trading with Dr. Terry Benzschawel
1 × $31.00
Natural Language Processing in Trading with Dr. Terry Benzschawel
1 × $31.00 -
×
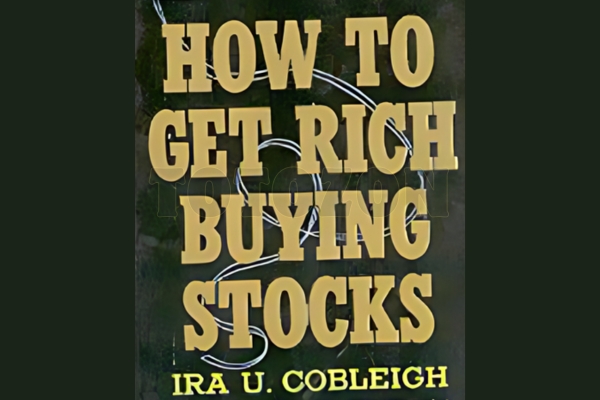 How to Get Rich Buying Stocks with Ira U.Cobleigh
1 × $6.00
How to Get Rich Buying Stocks with Ira U.Cobleigh
1 × $6.00 -
×
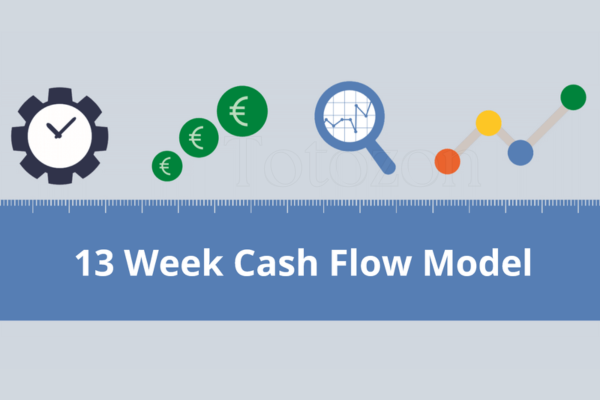 The 13-Week Cash Flow Model
1 × $15.00
The 13-Week Cash Flow Model
1 × $15.00 -
×
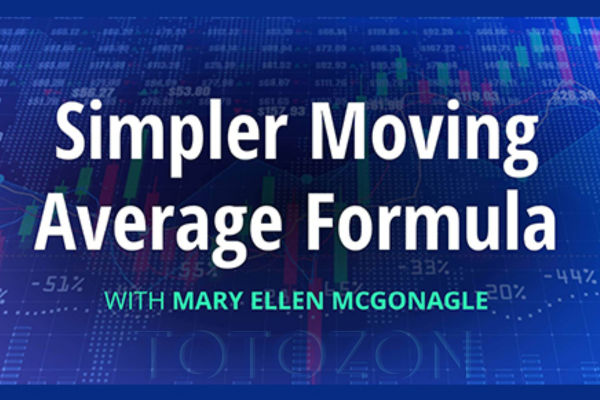 Discover the MEM Simple Moving Average Formula with Mary Ellen McGonagle
1 × $15.00
Discover the MEM Simple Moving Average Formula with Mary Ellen McGonagle
1 × $15.00 -
×
 Evolved Trader with Mark Croock
1 × $69.00
Evolved Trader with Mark Croock
1 × $69.00 -
×
 Options Wizardry from A to Z (Video 2.80 GB) with Don Fishback
1 × $6.00
Options Wizardry from A to Z (Video 2.80 GB) with Don Fishback
1 × $6.00 -
×
 Risk Stop Loss and Position Size with Daryl Guppy
1 × $6.00
Risk Stop Loss and Position Size with Daryl Guppy
1 × $6.00 -
×
 The Best Option Trading Course with David Jaffee - Best Stock Strategy
1 × $15.00
The Best Option Trading Course with David Jaffee - Best Stock Strategy
1 × $15.00 -
×
 Renko Profits Accelerator
1 × $15.00
Renko Profits Accelerator
1 × $15.00 -
×
 Swing Trading Futures & Commodities with the COT
1 × $93.00
Swing Trading Futures & Commodities with the COT
1 × $93.00 -
×
 D.A.T.E. Unlock Your Trading DNA Worskshop with Geoff Bysshe
1 × $6.00
D.A.T.E. Unlock Your Trading DNA Worskshop with Geoff Bysshe
1 × $6.00 -
×
 ETFs for the Long Run: What They Are, How They Work, and Simple Strategies for Successful Long-Term Investing - Lawrence Carrel
1 × $6.00
ETFs for the Long Run: What They Are, How They Work, and Simple Strategies for Successful Long-Term Investing - Lawrence Carrel
1 × $6.00 -
×
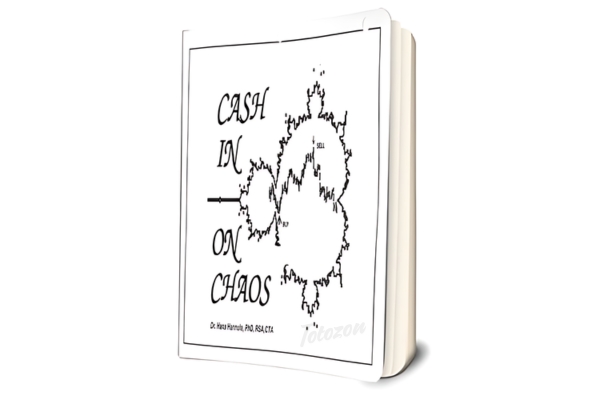 Cash In On Chaos with Hans Hannula
1 × $6.00
Cash In On Chaos with Hans Hannula
1 × $6.00 -
×
 The Hedge Bundle - SpotGamma Academy with Imran Lakha
1 × $8.00
The Hedge Bundle - SpotGamma Academy with Imran Lakha
1 × $8.00 -
×
 Cash Flow Investing Course
1 × $20.00
Cash Flow Investing Course
1 × $20.00 -
×
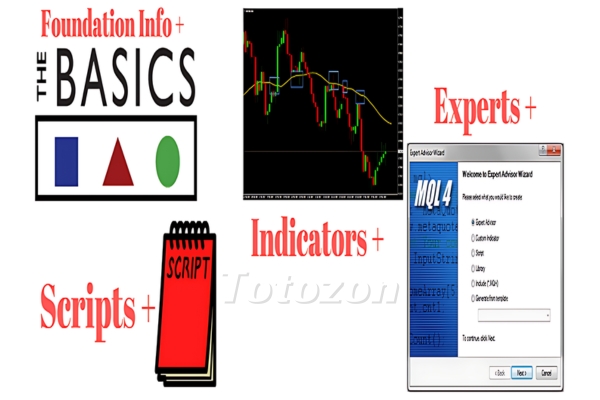 Mql4 Bundle: Basics, Scripts, Indicators, Experts with Jim Hodges
1 × $15.00
Mql4 Bundle: Basics, Scripts, Indicators, Experts with Jim Hodges
1 × $15.00 -
×
 The Any Hour Trading System with Markets Mastered
1 × $6.00
The Any Hour Trading System with Markets Mastered
1 × $6.00 -
×
 Master The Markets 2.0 with French Trader
1 × $6.00
Master The Markets 2.0 with French Trader
1 × $6.00 -
×
 Option Greeks Class with Don Kaufman
1 × $6.00
Option Greeks Class with Don Kaufman
1 × $6.00 -
×
 Pattern Trader Pro with ForexStore
1 × $6.00
Pattern Trader Pro with ForexStore
1 × $6.00 -
×
 Candlestick - Training Videos (Videos 1.2 GB)
1 × $15.00
Candlestick - Training Videos (Videos 1.2 GB)
1 × $15.00 -
×
 Trading Against the Crowd with John Summa
1 × $6.00
Trading Against the Crowd with John Summa
1 × $6.00 -
×
 Longlived Information & Intraday Pattern (Article) with Back and Andersen
1 × $6.00
Longlived Information & Intraday Pattern (Article) with Back and Andersen
1 × $6.00 -
×
 Crash Profits Make Money When Stocks Sink and Soar with Martin D.Weiss
1 × $6.00
Crash Profits Make Money When Stocks Sink and Soar with Martin D.Weiss
1 × $6.00 -
×
 Developing a Forex Trading Plan Webinar
1 × $6.00
Developing a Forex Trading Plan Webinar
1 × $6.00 -
×
 Commodity Speculation for Beginners with Charles Huff, Barbara Marinacci
1 × $6.00
Commodity Speculation for Beginners with Charles Huff, Barbara Marinacci
1 × $6.00 -
×
 Crypto Trading Academy with Cheeky Investor - Aussie Day Trader
1 × $13.00
Crypto Trading Academy with Cheeky Investor - Aussie Day Trader
1 × $13.00 -
×
 Newsbeat Master Class Recording
1 × $39.00
Newsbeat Master Class Recording
1 × $39.00 -
×
 Hedge Fund of Funds Investing with Joseph Nicholas
1 × $6.00
Hedge Fund of Funds Investing with Joseph Nicholas
1 × $6.00 -
×
 Fibonacci Mastery Course: Complete Guide to Trading with Fib By Todd Gordon
1 × $62.00
Fibonacci Mastery Course: Complete Guide to Trading with Fib By Todd Gordon
1 × $62.00 -
×
 Expert Forex Systems with Andrew Fields
1 × $6.00
Expert Forex Systems with Andrew Fields
1 × $6.00 -
×
 Fundamental Analysis with CA Rachana Ranade
1 × $5.00
Fundamental Analysis with CA Rachana Ranade
1 × $5.00 -
×
 How I Get Paid $1,000 Every Friday Trading Options with Jeff Tompkins
1 × $15.00
How I Get Paid $1,000 Every Friday Trading Options with Jeff Tompkins
1 × $15.00 -
×
 Trading Economic Data System with CopperChips
1 × $6.00
Trading Economic Data System with CopperChips
1 × $6.00 -
×
 Investing for the Long Term with Peter Bernstein
1 × $6.00
Investing for the Long Term with Peter Bernstein
1 × $6.00 -
×
 Investment Titans: Investment Insights from the Minds that Move Wall Street with Jonathan Burton
1 × $6.00
Investment Titans: Investment Insights from the Minds that Move Wall Street with Jonathan Burton
1 × $6.00 -
×
 Your Next Great Stock: How to Screen the Market for Tomorrow's Top Performers with Jack Hough
1 × $6.00
Your Next Great Stock: How to Screen the Market for Tomorrow's Top Performers with Jack Hough
1 × $6.00 -
×
 Traders World Past Issue Articles on CD with Magazine
1 × $6.00
Traders World Past Issue Articles on CD with Magazine
1 × $6.00 -
×
 NQ Price Action Mastery with Trade Smart
1 × $15.00
NQ Price Action Mastery with Trade Smart
1 × $15.00 -
×
 SOT Advanced Course (May 2014)
1 × $23.00
SOT Advanced Course (May 2014)
1 × $23.00 -
×
 Futures Trading Secrets Home Study Course 2004 with Bill McCready
1 × $7.00
Futures Trading Secrets Home Study Course 2004 with Bill McCready
1 × $7.00 -
×
 Mind & Markets. An Advanced Study Course of Stock Market Education (1951) with Bert Larson
1 × $6.00
Mind & Markets. An Advanced Study Course of Stock Market Education (1951) with Bert Larson
1 × $6.00 -
×
 The New Technical Trader with Chande Kroll
1 × $6.00
The New Technical Trader with Chande Kroll
1 × $6.00 -
×
 Module 1 & 2 Swing Trading Forex and Financial Futures with Trader Dante
1 × $15.00
Module 1 & 2 Swing Trading Forex and Financial Futures with Trader Dante
1 × $15.00 -
×
 Scalping Dow Jones 30 (DJI30) course - Live Trading Sessions with ISSAC Asimov
1 × $5.00
Scalping Dow Jones 30 (DJI30) course - Live Trading Sessions with ISSAC Asimov
1 × $5.00 -
×
 Fibonacci Trading & Dynamic Profit Targeting with Base Camp Trading
1 × $15.00
Fibonacci Trading & Dynamic Profit Targeting with Base Camp Trading
1 × $15.00 -
×
 The Stock Rocket Trading System with Dave Wooding
1 × $6.00
The Stock Rocket Trading System with Dave Wooding
1 × $6.00 -
×
 Investor’s Guide to Charting By Alistair Blair
1 × $6.00
Investor’s Guide to Charting By Alistair Blair
1 × $6.00 -
×
 Investment Philosophies
1 × $6.00
Investment Philosophies
1 × $6.00 -
×
 All About High-Frequency Trading with Michael Durbin
1 × $6.00
All About High-Frequency Trading with Michael Durbin
1 × $6.00 -
×
 The Way to Trade with John Piper
1 × $6.00
The Way to Trade with John Piper
1 × $6.00 -
×
 Forex Avenger Trading System with David Curran
1 × $6.00
Forex Avenger Trading System with David Curran
1 × $6.00 -
×
 Ambush Trading Method on Wheat & Corn with Marco Mayer
1 × $4.00
Ambush Trading Method on Wheat & Corn with Marco Mayer
1 × $4.00 -
×
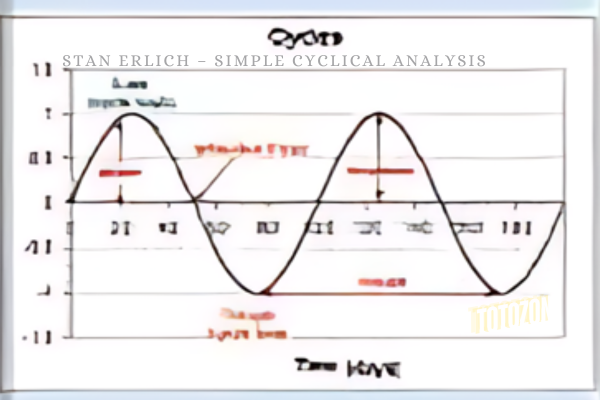 Simple Cyclical Analysis with Stan Erlich
1 × $6.00
Simple Cyclical Analysis with Stan Erlich
1 × $6.00 -
×
 Pit Bull with Martin Schwartz
1 × $6.00
Pit Bull with Martin Schwartz
1 × $6.00 -
×
 The Master Indicator 2023 with Lance Ippolito
1 × $101.00
The Master Indicator 2023 with Lance Ippolito
1 × $101.00 -
×
 Concerning The More Certain Fundamentals Of Astrology
1 × $6.00
Concerning The More Certain Fundamentals Of Astrology
1 × $6.00 -
×
 Emini Bonds
1 × $23.00
Emini Bonds
1 × $23.00 -
×
 Money Management Strategies for Serious Traders with David Stendahl
1 × $6.00
Money Management Strategies for Serious Traders with David Stendahl
1 × $6.00 -
×
 Applications of Abstract Algebra with Maple - Richard E.Kline, Neil Sigmon, Ernst Stitzinger
1 × $6.00
Applications of Abstract Algebra with Maple - Richard E.Kline, Neil Sigmon, Ernst Stitzinger
1 × $6.00 -
×
 Traders Positioning System with Lee Gettess
1 × $4.00
Traders Positioning System with Lee Gettess
1 × $4.00 -
×
 Day Trader Course
1 × $6.00
Day Trader Course
1 × $6.00 -
×
 Spotting Solid Short-Term Opportunities
1 × $6.00
Spotting Solid Short-Term Opportunities
1 × $6.00 -
×
 Scalp Strategy and Flipping Small Accounts with Opes Trading Group
1 × $5.00
Scalp Strategy and Flipping Small Accounts with Opes Trading Group
1 × $5.00

Practical Introduction to Bollinger Bands 2013
$6.00
File Size: Coming soon!
Delivery Time: 1–12 hours
Media Type: Online Course
Practical Introduction to Bollinger Bands 2013
Understanding Bollinger Bands
What Are Bollinger Bands?
Bollinger Bands are a popular technical analysis tool developed by John Bollinger in the 1980s. They consist of a middle band, which is a simple moving average, and two outer bands that are standard deviations away from the middle band. These bands help traders understand volatility and identify potential buy and sell signals.
Importance in Technical Analysis
Bollinger Bands are essential for traders because they provide a visual representation of price volatility and potential market reversals. They can be applied to various asset classes, including stocks, commodities, and currencies.
Components of Bollinger Bands
The Middle Band
The middle band is typically a 20-day simple moving average (SMA). This average smooths out price data, providing a central value around which the upper and lower bands are calculated.
The Upper and Lower Bands
The upper and lower bands are usually set two standard deviations away from the middle band. These bands expand and contract based on market volatility, offering insights into price movements.
Standard Deviation
Standard deviation measures the dispersion of data from its mean. In Bollinger Bands, it helps determine the distance between the upper and lower bands and the middle band.
Calculating Bollinger Bands
Step-by-Step Calculation
- Calculate the 20-day SMA: Add the closing prices of the past 20 days and divide by 20.
- Determine the standard deviation: Calculate the standard deviation of the same 20-day period.
- Upper Band: Middle Band + (2 * Standard Deviation)
- Lower Band: Middle Band – (2 * Standard Deviation)
Example Calculation
If the 20-day SMA is $100 and the standard deviation is $5, the upper band would be $110 ($100 + (2 * $5)) and the lower band would be $90 ($100 – (2 * $5)).
Using Bollinger Bands in Trading
Identifying Trends
Bollinger Bands can help identify the direction of a trend. When the price consistently touches the upper band, it indicates an uptrend. Conversely, touching the lower band suggests a downtrend.
Overbought and Oversold Conditions
When the price moves near the upper band, the asset might be overbought, signaling a potential sell. If the price approaches the lower band, it might be oversold, indicating a potential buy.
Breakouts and Volatility
Bollinger Bands can also signal breakouts. When the bands squeeze together, it indicates low volatility and a potential breakout. A sudden widening of the bands suggests increased volatility and potential trading opportunities.
Practical Applications
Trading Strategies
Bollinger Bounce
This strategy is based on the idea that the price will revert to the mean. When the price touches the upper band, traders might consider selling. Conversely, touching the lower band might be a buy signal.
Bollinger Squeeze
The Bollinger Squeeze strategy focuses on periods of low volatility. When the bands narrow, it suggests that a breakout is imminent. Traders can prepare to enter positions in the direction of the breakout.
Combining with Other Indicators
Bollinger Bands can be combined with other technical indicators like the Relative Strength Index (RSI) or Moving Average Convergence Divergence (MACD) to enhance trading decisions.
Advantages of Bollinger Bands
Visual Clarity
Bollinger Bands provide a clear visual representation of price volatility, making it easier for traders to identify potential buy and sell signals.
Flexibility
They can be used in various markets and on different time frames, making them versatile tools for traders of all styles.
Reliability
When used correctly, Bollinger Bands can be reliable indicators of market trends and potential reversals.
Limitations of Bollinger Bands
Not a Standalone Indicator
Bollinger Bands should not be used in isolation. They are most effective when combined with other technical analysis tools.
False Signals
Like all technical indicators, Bollinger Bands can produce false signals. Traders should use them with caution and confirm signals with additional analysis.
Tips for Using Bollinger Bands
Customize Settings
Traders can adjust the period and standard deviation settings of Bollinger Bands to suit their trading style and the specific asset being traded.
Monitor Market Conditions
Regularly review market conditions and adjust your trading strategy accordingly. Bollinger Bands are more effective in certain market environments.
Practice and Patience
Successful trading with Bollinger Bands requires practice and patience. Use a demo account to test strategies before applying them to live trading.
Conclusion
Bollinger Bands are a powerful tool for traders, offering insights into market volatility and potential trading opportunities. By understanding their components, calculations, and applications, traders can effectively incorporate Bollinger Bands into their trading strategies to improve their decision-making and profitability.
FAQs
What are Bollinger Bands used for?
Bollinger Bands are used to measure market volatility and identify potential buy and sell signals based on price movements relative to the bands.
How do you calculate Bollinger Bands?
Bollinger Bands are calculated using a 20-day simple moving average and adding/subtracting two standard deviations to create the upper and lower bands.
Can Bollinger Bands be used for day trading?
Yes, Bollinger Bands can be used for day trading, as well as swing trading and long-term investing, due to their flexibility in different time frames.
What is the Bollinger Squeeze?
The Bollinger Squeeze occurs when the bands narrow, indicating low volatility and a potential breakout. It suggests that traders should prepare for a possible significant price move.
Should Bollinger Bands be used with other indicators?
Yes, Bollinger Bands are most effective when used in conjunction with other technical indicators, such as RSI or MACD, to confirm signals and enhance trading decisions.
Be the first to review “Practical Introduction to Bollinger Bands 2013”
You must be logged in to post a review.
Related products

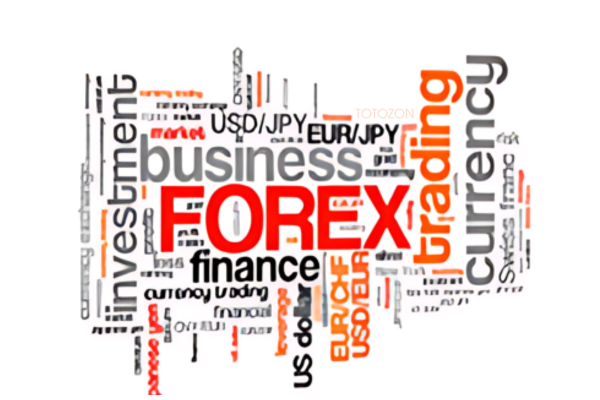
Forex Trading
Original price was: $797.00.$10.00Current price is: $10.00.

Original price was: $1,800.00.$54.00Current price is: $54.00.

Forex Trading
Original price was: $2,995.00.$31.00Current price is: $31.00.

Original price was: $4,995.00.$15.00Current price is: $15.00.

Forex Trading
Quantamentals – The Next Great Forefront Of Trading and Investing with Trading Markets
Original price was: $1,495.00.$8.00Current price is: $8.00.

Forex Trading
Original price was: $1,098.00.$39.00Current price is: $39.00.

Original price was: $197.00.$5.00Current price is: $5.00.

Original price was: $1,200.00.$23.00Current price is: $23.00.
Forex Trading
Original price was: $1,898.00.$10.00Current price is: $10.00.

Forex Trading
Original price was: $500.00.$5.00Current price is: $5.00.

Forex Trading
Original price was: $249.00.$15.00Current price is: $15.00.

Forex Trading
Original price was: $550.00.$5.00Current price is: $5.00.

Original price was: $799.00.$15.00Current price is: $15.00.

Forex Trading
Original price was: $799.00.$15.00Current price is: $15.00.

Forex Trading
Original price was: $397.00.$31.00Current price is: $31.00.

Forex Trading
Original price was: $2,997.00.$23.00Current price is: $23.00.

Forex Trading
Original price was: $499.00.$15.00Current price is: $15.00.

Forex Trading
Original price was: $125.00.$17.00Current price is: $17.00.

Forex Trading
Original price was: $4,997.00.$27.00Current price is: $27.00.

Original price was: $299.00.$8.00Current price is: $8.00.

Reviews
There are no reviews yet.