-
×
 Forex Mentor 2007 with Peter Bain
1 × $6.00
Forex Mentor 2007 with Peter Bain
1 × $6.00 -
×
 Rocket Science for Traders with John Ehlers
1 × $6.00
Rocket Science for Traders with John Ehlers
1 × $6.00 -
×
 Master Strategies of Super Achievers By Steven Scott
1 × $23.00
Master Strategies of Super Achievers By Steven Scott
1 × $23.00 -
×
 How To Be a Profitable Forex Trader with Corey Halliday
1 × $6.00
How To Be a Profitable Forex Trader with Corey Halliday
1 × $6.00 -
×
 How to Trade a Vertical Market
1 × $93.00
How to Trade a Vertical Market
1 × $93.00 -
×
 Day Trading For 50 Years PDF with Michael Jenkins
1 × $6.00
Day Trading For 50 Years PDF with Michael Jenkins
1 × $6.00 -
×
 High Probability ETF Trading: 7 Professional Strategies To Improve Your ETF Trading with Larry Connors
1 × $6.00
High Probability ETF Trading: 7 Professional Strategies To Improve Your ETF Trading with Larry Connors
1 × $6.00 -
×
 FX Daniel Savage Bundle (2in1)
1 × $23.00
FX Daniel Savage Bundle (2in1)
1 × $23.00 -
×
 Global Product with John Stark
1 × $6.00
Global Product with John Stark
1 × $6.00 -
×
 CFA Level 2 - Sample Item Sets 2003
1 × $6.00
CFA Level 2 - Sample Item Sets 2003
1 × $6.00 -
×
 Mastering Candlestick Charts II with Greg Capra
1 × $6.00
Mastering Candlestick Charts II with Greg Capra
1 × $6.00 -
×
 Forex Candlestick System. High Profit Forex Trading with B.M.Davis
1 × $6.00
Forex Candlestick System. High Profit Forex Trading with B.M.Davis
1 × $6.00 -
×
 IRON CONDORS FOR INCOME 2017 with Sheridan Options Mentoring
1 × $6.00
IRON CONDORS FOR INCOME 2017 with Sheridan Options Mentoring
1 × $6.00 -
×
 Snapbacks CD
1 × $6.00
Snapbacks CD
1 × $6.00 -
×
 Increasing Vertical Spread Probabilities with Technical Analysis with Doc Severson
1 × $6.00
Increasing Vertical Spread Probabilities with Technical Analysis with Doc Severson
1 × $6.00 -
×
 Stock Patterns for Day Trading Home Study Course
1 × $23.00
Stock Patterns for Day Trading Home Study Course
1 × $23.00 -
×
 All About High-Frequency Trading with Michael Durbin
1 × $6.00
All About High-Frequency Trading with Michael Durbin
1 × $6.00 -
×
 Profits in the Stock Market with Harold Gartley
1 × $6.00
Profits in the Stock Market with Harold Gartley
1 × $6.00 -
×
 Creating the Optimal Trade for Explosive Profits with George A.Fontanills
1 × $6.00
Creating the Optimal Trade for Explosive Profits with George A.Fontanills
1 × $6.00 -
×
 Simple Forex Profits with Rayy Bannzz
1 × $31.00
Simple Forex Profits with Rayy Bannzz
1 × $31.00 -
×
 Naked Trading Mastery
1 × $39.00
Naked Trading Mastery
1 × $39.00 -
×
 Forex Trading MasterClass with Torero Traders School
1 × $5.00
Forex Trading MasterClass with Torero Traders School
1 × $5.00 -
×
 Streetsmart Guide To Valuing a Stock (2nd Ed.) with Gary Gray
1 × $6.00
Streetsmart Guide To Valuing a Stock (2nd Ed.) with Gary Gray
1 × $6.00 -
×
 Mergers & Acquisitions From A to Z with Andrew J.Sherman
1 × $6.00
Mergers & Acquisitions From A to Z with Andrew J.Sherman
1 × $6.00 -
×
 Profitable Binary Options Strategies
1 × $5.00
Profitable Binary Options Strategies
1 × $5.00 -
×
 Simpler Options - Ultimate Guide to Debit Spreads – Nov 2014
1 × $6.00
Simpler Options - Ultimate Guide to Debit Spreads – Nov 2014
1 × $6.00 -
×
 Mind & Markets. An Advanced Study Course of Stock Market Education (1951) with Bert Larson
1 × $6.00
Mind & Markets. An Advanced Study Course of Stock Market Education (1951) with Bert Larson
1 × $6.00 -
×
 FlowRider Trading Course with Boris Schlossberg and Kathy Lien - Bkforex
1 × $15.00
FlowRider Trading Course with Boris Schlossberg and Kathy Lien - Bkforex
1 × $15.00 -
×
 ProfileTraders - Swing and Price Analysis (May 2014)
1 × $6.00
ProfileTraders - Swing and Price Analysis (May 2014)
1 × $6.00 -
×
 RSD - Alex’s Natural Instinct Method Manifesto
1 × $6.00
RSD - Alex’s Natural Instinct Method Manifesto
1 × $6.00 -
×
 A Litle Keltner, a Litle Wycoff and of lot of Street Smarts with Linda Raschke
1 × $6.00
A Litle Keltner, a Litle Wycoff and of lot of Street Smarts with Linda Raschke
1 × $6.00 -
×
 Inner Cicle Trader - ICT Methods with Michael Huddleston
1 × $5.00
Inner Cicle Trader - ICT Methods with Michael Huddleston
1 × $5.00 -
×
 Tradingconceptsinc - Calendar Spreads
1 × $23.00
Tradingconceptsinc - Calendar Spreads
1 × $23.00 -
×
 How I Trade for a Living with Gary Smith
1 × $6.00
How I Trade for a Living with Gary Smith
1 × $6.00 -
×
 Scanning For Gold with Doug Sutton
1 × $6.00
Scanning For Gold with Doug Sutton
1 × $6.00 -
×
 High Probability Patterns and Rule Based Trading with Jake Bernstein
1 × $6.00
High Probability Patterns and Rule Based Trading with Jake Bernstein
1 × $6.00 -
×
 Ezaih Academy 2024 Mentorship with Ezaih
1 × $54.00
Ezaih Academy 2024 Mentorship with Ezaih
1 × $54.00 -
×
 Forex Education Trading System (Video 469 MB)
1 × $23.00
Forex Education Trading System (Video 469 MB)
1 × $23.00 -
×
 Smart Money Concepts with MFX Trading
1 × $13.00
Smart Money Concepts with MFX Trading
1 × $13.00 -
×
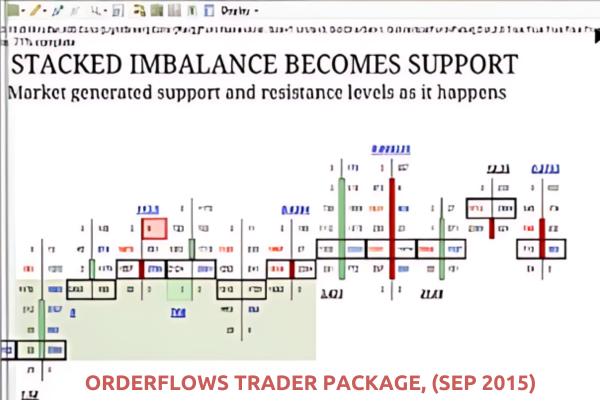 OrderFlows Trader Package, (Sep 2015)
1 × $54.00
OrderFlows Trader Package, (Sep 2015)
1 × $54.00 -
×
 WondaFX Signature Strategy with WondaFX
1 × $5.00
WondaFX Signature Strategy with WondaFX
1 × $5.00 -
×
 European Members - March 2023 with Stockbee
1 × $5.00
European Members - March 2023 with Stockbee
1 × $5.00 -
×
 Tharp Think Essentials Video Workshop with Van Tharp
1 × $5.00
Tharp Think Essentials Video Workshop with Van Tharp
1 × $5.00 -
×
 Cryptocurrency Investing Master Class with Stone River eLearning
1 × $6.00
Cryptocurrency Investing Master Class with Stone River eLearning
1 × $6.00 -
×
 Investing Online with Benton E.Gup
1 × $6.00
Investing Online with Benton E.Gup
1 × $6.00 -
×
 Learn Plan Profit – How To Trade Stocks
1 × $15.00
Learn Plan Profit – How To Trade Stocks
1 × $15.00 -
×
 How I Get Paid $1,000 Every Friday Trading Options with Jeff Tompkins
1 × $15.00
How I Get Paid $1,000 Every Friday Trading Options with Jeff Tompkins
1 × $15.00 -
×
 Sacredscience - Raphael – Book of Fate
1 × $6.00
Sacredscience - Raphael – Book of Fate
1 × $6.00 -
×
 Weekly Options Windfall and Bonus with James Preston
1 × $54.00
Weekly Options Windfall and Bonus with James Preston
1 × $54.00 -
×
 Penny Stock Mastery
1 × $31.00
Penny Stock Mastery
1 × $31.00 -
×
 Forex Wave Theory: A Technical Analysis for Spot and Futures Curency Traders - James Bickford
1 × $6.00
Forex Wave Theory: A Technical Analysis for Spot and Futures Curency Traders - James Bickford
1 × $6.00 -
×
 Confessions of a Street Addict with James Cramer
1 × $6.00
Confessions of a Street Addict with James Cramer
1 × $6.00 -
×
 Pattern- Price & Time. Using Gann Theory in Trading Systems (2nd Ed.)
1 × $6.00
Pattern- Price & Time. Using Gann Theory in Trading Systems (2nd Ed.)
1 × $6.00 -
×
 The Janus Factor with Gary Anderson
1 × $6.00
The Janus Factor with Gary Anderson
1 × $6.00 -
×
 Pristine - Noble DraKoln – The Complete Liverpool Futures Seminar Series
1 × $6.00
Pristine - Noble DraKoln – The Complete Liverpool Futures Seminar Series
1 × $6.00 -
×
 Natural Squares Calculator with Lambert-Gann Educators
1 × $6.00
Natural Squares Calculator with Lambert-Gann Educators
1 × $6.00 -
×
 Practical Approach to Amibroker Backtesting with Rajandran R
1 × $6.00
Practical Approach to Amibroker Backtesting with Rajandran R
1 × $6.00 -
×
 Options On Futures Class By Mark Fenton - Sheridan Options Mentoring
1 × $6.00
Options On Futures Class By Mark Fenton - Sheridan Options Mentoring
1 × $6.00 -
×
 London Close Trade 2.0 with Shirley Hudson & Vic Noble - Forex Mentor
1 × $5.00
London Close Trade 2.0 with Shirley Hudson & Vic Noble - Forex Mentor
1 × $5.00 -
×
 Optionpit - Mastering Iron Condors and Butterflies
1 × $15.00
Optionpit - Mastering Iron Condors and Butterflies
1 × $15.00 -
×
 The Geography of Money with Benjamin J.Cohen
1 × $6.00
The Geography of Money with Benjamin J.Cohen
1 × $6.00 -
×
 Scalping Dow Jones 30 (DJI30) course - Live Trading Sessions with ISSAC Asimov
1 × $5.00
Scalping Dow Jones 30 (DJI30) course - Live Trading Sessions with ISSAC Asimov
1 × $5.00 -
×
 Handbook for Enviroment Risk Decision Making with C.Richard Cothern
1 × $6.00
Handbook for Enviroment Risk Decision Making with C.Richard Cothern
1 × $6.00 -
×
 Chaos. The New Map for Traders
1 × $15.00
Chaos. The New Map for Traders
1 × $15.00 -
×
 Million Dollar Stock Market Idea with Larry Williams
1 × $6.00
Million Dollar Stock Market Idea with Larry Williams
1 × $6.00 -
×
 Opening Bell Income Strategy with Todd Mitchell
1 × $54.00
Opening Bell Income Strategy with Todd Mitchell
1 × $54.00 -
×
 A+ Setups Big Caps Options with Jtrader
1 × $6.00
A+ Setups Big Caps Options with Jtrader
1 × $6.00 -
×
 Ultimate Trading Course with Dodgy's Dungeon
1 × $8.00
Ultimate Trading Course with Dodgy's Dungeon
1 × $8.00

Practical Introduction to Bollinger Bands 2013
$6.00
File Size: Coming soon!
Delivery Time: 1–12 hours
Media Type: Online Course
Practical Introduction to Bollinger Bands 2013
Understanding Bollinger Bands
What Are Bollinger Bands?
Bollinger Bands are a popular technical analysis tool developed by John Bollinger in the 1980s. They consist of a middle band, which is a simple moving average, and two outer bands that are standard deviations away from the middle band. These bands help traders understand volatility and identify potential buy and sell signals.
Importance in Technical Analysis
Bollinger Bands are essential for traders because they provide a visual representation of price volatility and potential market reversals. They can be applied to various asset classes, including stocks, commodities, and currencies.
Components of Bollinger Bands
The Middle Band
The middle band is typically a 20-day simple moving average (SMA). This average smooths out price data, providing a central value around which the upper and lower bands are calculated.
The Upper and Lower Bands
The upper and lower bands are usually set two standard deviations away from the middle band. These bands expand and contract based on market volatility, offering insights into price movements.
Standard Deviation
Standard deviation measures the dispersion of data from its mean. In Bollinger Bands, it helps determine the distance between the upper and lower bands and the middle band.
Calculating Bollinger Bands
Step-by-Step Calculation
- Calculate the 20-day SMA: Add the closing prices of the past 20 days and divide by 20.
- Determine the standard deviation: Calculate the standard deviation of the same 20-day period.
- Upper Band: Middle Band + (2 * Standard Deviation)
- Lower Band: Middle Band – (2 * Standard Deviation)
Example Calculation
If the 20-day SMA is $100 and the standard deviation is $5, the upper band would be $110 ($100 + (2 * $5)) and the lower band would be $90 ($100 – (2 * $5)).
Using Bollinger Bands in Trading
Identifying Trends
Bollinger Bands can help identify the direction of a trend. When the price consistently touches the upper band, it indicates an uptrend. Conversely, touching the lower band suggests a downtrend.
Overbought and Oversold Conditions
When the price moves near the upper band, the asset might be overbought, signaling a potential sell. If the price approaches the lower band, it might be oversold, indicating a potential buy.
Breakouts and Volatility
Bollinger Bands can also signal breakouts. When the bands squeeze together, it indicates low volatility and a potential breakout. A sudden widening of the bands suggests increased volatility and potential trading opportunities.
Practical Applications
Trading Strategies
Bollinger Bounce
This strategy is based on the idea that the price will revert to the mean. When the price touches the upper band, traders might consider selling. Conversely, touching the lower band might be a buy signal.
Bollinger Squeeze
The Bollinger Squeeze strategy focuses on periods of low volatility. When the bands narrow, it suggests that a breakout is imminent. Traders can prepare to enter positions in the direction of the breakout.
Combining with Other Indicators
Bollinger Bands can be combined with other technical indicators like the Relative Strength Index (RSI) or Moving Average Convergence Divergence (MACD) to enhance trading decisions.
Advantages of Bollinger Bands
Visual Clarity
Bollinger Bands provide a clear visual representation of price volatility, making it easier for traders to identify potential buy and sell signals.
Flexibility
They can be used in various markets and on different time frames, making them versatile tools for traders of all styles.
Reliability
When used correctly, Bollinger Bands can be reliable indicators of market trends and potential reversals.
Limitations of Bollinger Bands
Not a Standalone Indicator
Bollinger Bands should not be used in isolation. They are most effective when combined with other technical analysis tools.
False Signals
Like all technical indicators, Bollinger Bands can produce false signals. Traders should use them with caution and confirm signals with additional analysis.
Tips for Using Bollinger Bands
Customize Settings
Traders can adjust the period and standard deviation settings of Bollinger Bands to suit their trading style and the specific asset being traded.
Monitor Market Conditions
Regularly review market conditions and adjust your trading strategy accordingly. Bollinger Bands are more effective in certain market environments.
Practice and Patience
Successful trading with Bollinger Bands requires practice and patience. Use a demo account to test strategies before applying them to live trading.
Conclusion
Bollinger Bands are a powerful tool for traders, offering insights into market volatility and potential trading opportunities. By understanding their components, calculations, and applications, traders can effectively incorporate Bollinger Bands into their trading strategies to improve their decision-making and profitability.
FAQs
What are Bollinger Bands used for?
Bollinger Bands are used to measure market volatility and identify potential buy and sell signals based on price movements relative to the bands.
How do you calculate Bollinger Bands?
Bollinger Bands are calculated using a 20-day simple moving average and adding/subtracting two standard deviations to create the upper and lower bands.
Can Bollinger Bands be used for day trading?
Yes, Bollinger Bands can be used for day trading, as well as swing trading and long-term investing, due to their flexibility in different time frames.
What is the Bollinger Squeeze?
The Bollinger Squeeze occurs when the bands narrow, indicating low volatility and a potential breakout. It suggests that traders should prepare for a possible significant price move.
Should Bollinger Bands be used with other indicators?
Yes, Bollinger Bands are most effective when used in conjunction with other technical indicators, such as RSI or MACD, to confirm signals and enhance trading decisions.
Be the first to review “Practical Introduction to Bollinger Bands 2013”
You must be logged in to post a review.
Related products
Forex Trading
Original price was: $550.00.$5.00Current price is: $5.00.

Original price was: $139.00.$23.00Current price is: $23.00.

Original price was: $497.00.$11.00Current price is: $11.00.

Original price was: $997.00.$8.00Current price is: $8.00.

Original price was: $700.00.$39.00Current price is: $39.00.
Forex Trading
Original price was: $239.00.$8.00Current price is: $8.00.

Original price was: $649.00.$20.00Current price is: $20.00.

Forex Trading
Original price was: $697.00.$5.00Current price is: $5.00.

Forex Trading
The Complete Guide to Multiple Time Frame Analysis & Reading Price Action with Aiman Almansoori
Original price was: $1,399.00.$13.00Current price is: $13.00.

Original price was: $450.00.$23.00Current price is: $23.00.

Original price was: $197.00.$5.00Current price is: $5.00.

Forex Trading
Original price was: $2,997.00.$23.00Current price is: $23.00.

Original price was: $497.00.$31.00Current price is: $31.00.

Original price was: $1,849.00.$15.00Current price is: $15.00.

Forex Trading
Original price was: $249.00.$15.00Current price is: $15.00.

Forex Trading
Original price was: $850.00.$23.00Current price is: $23.00.

Original price was: $999.00.$5.00Current price is: $5.00.

Original price was: $299.00.$8.00Current price is: $8.00.

Forex Trading
Original price was: $499.00.$15.00Current price is: $15.00.

Forex Trading
Original price was: $500.00.$5.00Current price is: $5.00.

Reviews
There are no reviews yet.