-
×
 Core Strategy Program + Extended Learning Track with Ota Courses
1 × $124.00
Core Strategy Program + Extended Learning Track with Ota Courses
1 × $124.00 -
×
 FuturesTrader71 - webinar series (4 webinars)
1 × $6.00
FuturesTrader71 - webinar series (4 webinars)
1 × $6.00 -
×
 Diary of an Internet Trader with Alpesh Patel
1 × $6.00
Diary of an Internet Trader with Alpesh Patel
1 × $6.00 -
×
 Futures Broker Home Study Course CTA Series 3 (Fourteenth Ed.) with Center for Futures Education
1 × $6.00
Futures Broker Home Study Course CTA Series 3 (Fourteenth Ed.) with Center for Futures Education
1 × $6.00 -
×
 The Indices Orderflow Masterclass with The Forex Scalpers
1 × $23.00
The Indices Orderflow Masterclass with The Forex Scalpers
1 × $23.00 -
×
 DiNapoli Levels Training Course with Joe DiNapoli & Merrick Okamoto
1 × $6.00
DiNapoli Levels Training Course with Joe DiNapoli & Merrick Okamoto
1 × $6.00 -
×
 The Candlestick Training Series with Timon Weller
1 × $6.00
The Candlestick Training Series with Timon Weller
1 × $6.00 -
×
 8 Strategies for Day Trading
1 × $31.00
8 Strategies for Day Trading
1 × $31.00 -
×
 Futures Spread Trading Intro Course with Thetradingframework
1 × $6.00
Futures Spread Trading Intro Course with Thetradingframework
1 × $6.00 -
×
 Market Profile Video with FutexLive
1 × $6.00
Market Profile Video with FutexLive
1 × $6.00 -
×
 Investment Intelligence from Insider Trading with H.N.Seyhun
1 × $6.00
Investment Intelligence from Insider Trading with H.N.Seyhun
1 × $6.00 -
×
 W. D Gann 's Square Of 9 Applied To Modern Markets with Sean Avidar - Hexatrade350
1 × $23.00
W. D Gann 's Square Of 9 Applied To Modern Markets with Sean Avidar - Hexatrade350
1 × $23.00 -
×
 The Great Depression with David Burg
1 × $6.00
The Great Depression with David Burg
1 × $6.00 -
×
 All About Bonds, Bond Mutual Funds & Bond ETFs (3rd Ed.) with Esme Faerber
1 × $6.00
All About Bonds, Bond Mutual Funds & Bond ETFs (3rd Ed.) with Esme Faerber
1 × $6.00 -
×
 High Probability ETF Trading: 7 Professional Strategies To Improve Your ETF Trading with Larry Connors
1 × $6.00
High Probability ETF Trading: 7 Professional Strategies To Improve Your ETF Trading with Larry Connors
1 × $6.00 -
×
 Dumb Money: Adventures of a Day Trader with Joey Anuff
1 × $6.00
Dumb Money: Adventures of a Day Trader with Joey Anuff
1 × $6.00 -
×
 Practical Portfolio Performance Measurement and Attribution (2nd Ed.) with Carl Bacon
1 × $6.00
Practical Portfolio Performance Measurement and Attribution (2nd Ed.) with Carl Bacon
1 × $6.00 -
×
 The Trading Blueprint with Brad Goh - The Trading Geek
1 × $5.00
The Trading Blueprint with Brad Goh - The Trading Geek
1 × $5.00 -
×
 How to Analyze Multifamily Investment Opportunities with Symon He & Brandon Young
1 × $6.00
How to Analyze Multifamily Investment Opportunities with Symon He & Brandon Young
1 × $6.00 -
×
 Pristine Seminar - Options Trading the Pristine Way
1 × $6.00
Pristine Seminar - Options Trading the Pristine Way
1 × $6.00 -
×
 Investing In Fixer-Uppers 2003 with Jay DeCima
1 × $6.00
Investing In Fixer-Uppers 2003 with Jay DeCima
1 × $6.00 -
×
 Handbook on the Knowledge Economy with David Rooney
1 × $6.00
Handbook on the Knowledge Economy with David Rooney
1 × $6.00 -
×
 Lazy Emini Trader Master Class
1 × $15.00
Lazy Emini Trader Master Class
1 × $15.00 -
×
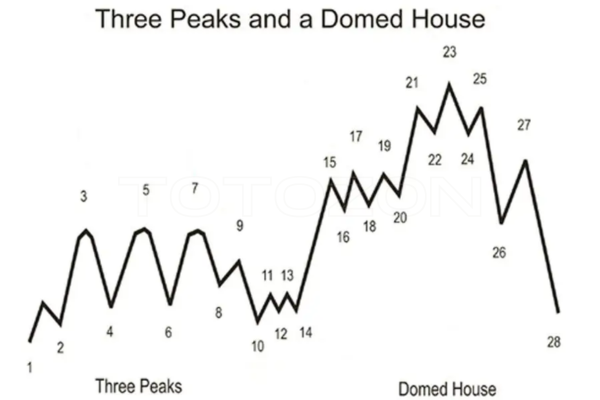 George Lindays. 3 Peaks and the Domed House Revised with Barclay T.Leib
1 × $6.00
George Lindays. 3 Peaks and the Domed House Revised with Barclay T.Leib
1 × $6.00 -
×
 Earnings Engine with Sami Abusaad - T3 Live
1 × $6.00
Earnings Engine with Sami Abusaad - T3 Live
1 × $6.00 -
×
 The First Time Investors Workbook with Joe Jonh Duran & Larry Chambers
1 × $6.00
The First Time Investors Workbook with Joe Jonh Duran & Larry Chambers
1 × $6.00 -
×
 Elite Mentorship Home Study - 3T Live with Sami Abusaad
1 × $5.00
Elite Mentorship Home Study - 3T Live with Sami Abusaad
1 × $5.00 -
×
 Pattern Picking with Charles Drummond
1 × $6.00
Pattern Picking with Charles Drummond
1 × $6.00 -
×
 A Momentum Based Approach to Swing Trading with Dave Landry
1 × $6.00
A Momentum Based Approach to Swing Trading with Dave Landry
1 × $6.00 -
×
 Fundamentals of the Securities Industry with William A.Rini
1 × $6.00
Fundamentals of the Securities Industry with William A.Rini
1 × $6.00 -
×
 After Hour Trading Made Easy with Joe Duarte & Roland Burke
1 × $6.00
After Hour Trading Made Easy with Joe Duarte & Roland Burke
1 × $6.00 -
×
 Traders Secret Library
1 × $6.00
Traders Secret Library
1 × $6.00 -
×
 $20 – 52k 20 pips a day challange with Rafał Zuchowicz - TopMasterTrader
1 × $5.00
$20 – 52k 20 pips a day challange with Rafał Zuchowicz - TopMasterTrader
1 × $5.00 -
×
![ACD Method [Video (6 MP4s)] with Mark Fisher](https://www.totozon.com/wp-content/uploads/2024/05/ACD-Method-Video-6-MP4s-with-Mark-Fisher.jpg) ACD Method [Video (6 MP4s)] with Mark Fisher
1 × $6.00
ACD Method [Video (6 MP4s)] with Mark Fisher
1 × $6.00 -
×
 Algo Trading Masterclass with Ali Casey - StatOasis
1 × $23.00
Algo Trading Masterclass with Ali Casey - StatOasis
1 × $23.00 -
×
 Forty Cents for Financial Freedom with Darlene Nelson
1 × $6.00
Forty Cents for Financial Freedom with Darlene Nelson
1 × $6.00 -
×
 The Vital Few vs. the Trivial Many: Invest with the Insiders, Not the Masses with George Muzea
1 × $6.00
The Vital Few vs. the Trivial Many: Invest with the Insiders, Not the Masses with George Muzea
1 × $6.00 -
×
 Knowing Where the Energy is Coming From with Charles Drummond
1 × $6.00
Knowing Where the Energy is Coming From with Charles Drummond
1 × $6.00 -
×
 Forex Trading Course with Mike Norman
1 × $17.00
Forex Trading Course with Mike Norman
1 × $17.00 -
×
 B.O.S.S (Break Out Scalping Strategy) with Lee Scholfield
1 × $6.00
B.O.S.S (Break Out Scalping Strategy) with Lee Scholfield
1 × $6.00 -
×
 Picking the Best Stocks & Strategies for every Option Trade with James Bittman
1 × $6.00
Picking the Best Stocks & Strategies for every Option Trade with James Bittman
1 × $6.00 -
×
 Crash Profits Make Money When Stocks Sink and Soar with Martin D.Weiss
1 × $6.00
Crash Profits Make Money When Stocks Sink and Soar with Martin D.Weiss
1 × $6.00 -
×
 ICT Prodigy Trading Course – $650K in Payouts with Alex Solignani
1 × $15.00
ICT Prodigy Trading Course – $650K in Payouts with Alex Solignani
1 × $15.00 -
×
 Ichimoku Cloud Trading System Class with Jeff Bierman
1 × $6.00
Ichimoku Cloud Trading System Class with Jeff Bierman
1 × $6.00 -
×
 The Heretics of Finance with Andrew Lo & Jasmina Hasanhodzic
1 × $4.00
The Heretics of Finance with Andrew Lo & Jasmina Hasanhodzic
1 × $4.00 -
×
 CNBC 24-7 Trading with Barbara Rockefeller
1 × $6.00
CNBC 24-7 Trading with Barbara Rockefeller
1 × $6.00 -
×
 ICT Charter Complete Course (2019)
1 × $13.00
ICT Charter Complete Course (2019)
1 × $13.00 -
×
 Investment Blunders with John Nofsinger
1 × $6.00
Investment Blunders with John Nofsinger
1 × $6.00 -
×
 Ultimate Trading Course with Dodgy's Dungeon
1 × $8.00
Ultimate Trading Course with Dodgy's Dungeon
1 × $8.00

Practical Introduction to Bollinger Bands 2013
$6.00
File Size: Coming soon!
Delivery Time: 1–12 hours
Media Type: Online Course
Practical Introduction to Bollinger Bands 2013
Understanding Bollinger Bands
What Are Bollinger Bands?
Bollinger Bands are a popular technical analysis tool developed by John Bollinger in the 1980s. They consist of a middle band, which is a simple moving average, and two outer bands that are standard deviations away from the middle band. These bands help traders understand volatility and identify potential buy and sell signals.
Importance in Technical Analysis
Bollinger Bands are essential for traders because they provide a visual representation of price volatility and potential market reversals. They can be applied to various asset classes, including stocks, commodities, and currencies.
Components of Bollinger Bands
The Middle Band
The middle band is typically a 20-day simple moving average (SMA). This average smooths out price data, providing a central value around which the upper and lower bands are calculated.
The Upper and Lower Bands
The upper and lower bands are usually set two standard deviations away from the middle band. These bands expand and contract based on market volatility, offering insights into price movements.
Standard Deviation
Standard deviation measures the dispersion of data from its mean. In Bollinger Bands, it helps determine the distance between the upper and lower bands and the middle band.
Calculating Bollinger Bands
Step-by-Step Calculation
- Calculate the 20-day SMA: Add the closing prices of the past 20 days and divide by 20.
- Determine the standard deviation: Calculate the standard deviation of the same 20-day period.
- Upper Band: Middle Band + (2 * Standard Deviation)
- Lower Band: Middle Band – (2 * Standard Deviation)
Example Calculation
If the 20-day SMA is $100 and the standard deviation is $5, the upper band would be $110 ($100 + (2 * $5)) and the lower band would be $90 ($100 – (2 * $5)).
Using Bollinger Bands in Trading
Identifying Trends
Bollinger Bands can help identify the direction of a trend. When the price consistently touches the upper band, it indicates an uptrend. Conversely, touching the lower band suggests a downtrend.
Overbought and Oversold Conditions
When the price moves near the upper band, the asset might be overbought, signaling a potential sell. If the price approaches the lower band, it might be oversold, indicating a potential buy.
Breakouts and Volatility
Bollinger Bands can also signal breakouts. When the bands squeeze together, it indicates low volatility and a potential breakout. A sudden widening of the bands suggests increased volatility and potential trading opportunities.
Practical Applications
Trading Strategies
Bollinger Bounce
This strategy is based on the idea that the price will revert to the mean. When the price touches the upper band, traders might consider selling. Conversely, touching the lower band might be a buy signal.
Bollinger Squeeze
The Bollinger Squeeze strategy focuses on periods of low volatility. When the bands narrow, it suggests that a breakout is imminent. Traders can prepare to enter positions in the direction of the breakout.
Combining with Other Indicators
Bollinger Bands can be combined with other technical indicators like the Relative Strength Index (RSI) or Moving Average Convergence Divergence (MACD) to enhance trading decisions.
Advantages of Bollinger Bands
Visual Clarity
Bollinger Bands provide a clear visual representation of price volatility, making it easier for traders to identify potential buy and sell signals.
Flexibility
They can be used in various markets and on different time frames, making them versatile tools for traders of all styles.
Reliability
When used correctly, Bollinger Bands can be reliable indicators of market trends and potential reversals.
Limitations of Bollinger Bands
Not a Standalone Indicator
Bollinger Bands should not be used in isolation. They are most effective when combined with other technical analysis tools.
False Signals
Like all technical indicators, Bollinger Bands can produce false signals. Traders should use them with caution and confirm signals with additional analysis.
Tips for Using Bollinger Bands
Customize Settings
Traders can adjust the period and standard deviation settings of Bollinger Bands to suit their trading style and the specific asset being traded.
Monitor Market Conditions
Regularly review market conditions and adjust your trading strategy accordingly. Bollinger Bands are more effective in certain market environments.
Practice and Patience
Successful trading with Bollinger Bands requires practice and patience. Use a demo account to test strategies before applying them to live trading.
Conclusion
Bollinger Bands are a powerful tool for traders, offering insights into market volatility and potential trading opportunities. By understanding their components, calculations, and applications, traders can effectively incorporate Bollinger Bands into their trading strategies to improve their decision-making and profitability.
FAQs
What are Bollinger Bands used for?
Bollinger Bands are used to measure market volatility and identify potential buy and sell signals based on price movements relative to the bands.
How do you calculate Bollinger Bands?
Bollinger Bands are calculated using a 20-day simple moving average and adding/subtracting two standard deviations to create the upper and lower bands.
Can Bollinger Bands be used for day trading?
Yes, Bollinger Bands can be used for day trading, as well as swing trading and long-term investing, due to their flexibility in different time frames.
What is the Bollinger Squeeze?
The Bollinger Squeeze occurs when the bands narrow, indicating low volatility and a potential breakout. It suggests that traders should prepare for a possible significant price move.
Should Bollinger Bands be used with other indicators?
Yes, Bollinger Bands are most effective when used in conjunction with other technical indicators, such as RSI or MACD, to confirm signals and enhance trading decisions.
Be the first to review “Practical Introduction to Bollinger Bands 2013”
You must be logged in to post a review.
Related products

Original price was: $4,995.00.$15.00Current price is: $15.00.
Forex Trading
Original price was: $1,898.00.$10.00Current price is: $10.00.

Original price was: $1,800.00.$54.00Current price is: $54.00.
Original price was: $450.00.$23.00Current price is: $23.00.

Original price was: $700.00.$39.00Current price is: $39.00.

Original price was: $497.00.$11.00Current price is: $11.00.
Forex Trading
Original price was: $697.00.$5.00Current price is: $5.00.

Forex Trading
Original price was: $799.00.$15.00Current price is: $15.00.

Original price was: $895.00.$15.00Current price is: $15.00.
Original price was: $139.00.$23.00Current price is: $23.00.
Forex Trading
Original price was: $239.00.$8.00Current price is: $8.00.

Forex Trading
Original price was: $249.00.$15.00Current price is: $15.00.

Original price was: $649.00.$20.00Current price is: $20.00.

Original price was: $695.00.$41.00Current price is: $41.00.

Forex Trading
Original price was: $850.00.$23.00Current price is: $23.00.

Forex Trading
Quantamentals – The Next Great Forefront Of Trading and Investing with Trading Markets
Original price was: $1,495.00.$8.00Current price is: $8.00.

Original price was: $999.00.$5.00Current price is: $5.00.

Original price was: $310.00.$23.00Current price is: $23.00.
Original price was: $2,120.00.$15.00Current price is: $15.00.

Original price was: $997.00.$8.00Current price is: $8.00.

Reviews
There are no reviews yet.