-
×
 Behavior and Performance of Investment Newsletter Analysts (Article) with Alok Kumar
1 × $6.00
Behavior and Performance of Investment Newsletter Analysts (Article) with Alok Kumar
1 × $6.00 -
×
 Freak Forex Technicals with Ken FX Freak
1 × $6.00
Freak Forex Technicals with Ken FX Freak
1 × $6.00 -
×
 TREND/REV BLOCK AND EA FOREX SYSTEM (No MT4 Indicator) with IFXSuccess
1 × $69.00
TREND/REV BLOCK AND EA FOREX SYSTEM (No MT4 Indicator) with IFXSuccess
1 × $69.00 -
×
 FX Prosperity Academy with Leonard Williams Jr
1 × $5.00
FX Prosperity Academy with Leonard Williams Jr
1 × $5.00 -
×
 War Room Technicals Vol. 4 with Pat Mitchell – Trick Trades
1 × $6.00
War Room Technicals Vol. 4 with Pat Mitchell – Trick Trades
1 × $6.00 -
×
 Forex Trading Systems Elearning Course - Busted Breakout System with Van Tharp
1 × $6.00
Forex Trading Systems Elearning Course - Busted Breakout System with Van Tharp
1 × $6.00 -
×
 Simple Sector Trading Strategies with John Murphy
1 × $6.00
Simple Sector Trading Strategies with John Murphy
1 × $6.00 -
×
 Traders Guide to Emotional Management with Brian McAboy
1 × $4.00
Traders Guide to Emotional Management with Brian McAboy
1 × $4.00 -
×
 Crypto Trading Cyber Security for Bitcoin & Altcoin Holders with Zlatin Georgiev
1 × $5.00
Crypto Trading Cyber Security for Bitcoin & Altcoin Holders with Zlatin Georgiev
1 × $5.00 -
×
 Capital Flows and Crises with Barry Eichengreen
1 × $6.00
Capital Flows and Crises with Barry Eichengreen
1 × $6.00 -
×
 eASCTrend Pro 6.0 Video Tutorials with Ablesys
1 × $6.00
eASCTrend Pro 6.0 Video Tutorials with Ablesys
1 × $6.00 -
×
 Best of the Best: Collars with Amy Meissner & Scott Ruble
1 × $15.00
Best of the Best: Collars with Amy Meissner & Scott Ruble
1 × $15.00 -
×
 Crypto Momentum Trading System with Pollinate Trading
1 × $34.00
Crypto Momentum Trading System with Pollinate Trading
1 × $34.00 -
×
 Forex Mastermind with FOREX4NOOBS
1 × $5.00
Forex Mastermind with FOREX4NOOBS
1 × $5.00 -
×
 ActiveBeta Indexes. Capturing Systematic Sources of Active Equity Returns (HTML) with Andrew Lo
1 × $6.00
ActiveBeta Indexes. Capturing Systematic Sources of Active Equity Returns (HTML) with Andrew Lo
1 × $6.00 -
×
 Commitments of Traders : Strategies for Tracking the Market and Trading Profitably with Floyd Upperman
1 × $6.00
Commitments of Traders : Strategies for Tracking the Market and Trading Profitably with Floyd Upperman
1 × $6.00 -
×
 BSAPPS FX Course with Ben Barker
1 × $6.00
BSAPPS FX Course with Ben Barker
1 × $6.00 -
×
 The Stock Market, Credit & Capital Formation with Fritz Machlup
1 × $6.00
The Stock Market, Credit & Capital Formation with Fritz Machlup
1 × $6.00 -
×
 The Orderflow Masterclass with PrimeTrading
1 × $17.00
The Orderflow Masterclass with PrimeTrading
1 × $17.00 -
×
 Mindover Markets Enhanced: The Intensive Series 2 with Jim Dalton
1 × $20.00
Mindover Markets Enhanced: The Intensive Series 2 with Jim Dalton
1 × $20.00 -
×
 Getting Started in Options (3rd Ed.) with Michael Thomsett
1 × $6.00
Getting Started in Options (3rd Ed.) with Michael Thomsett
1 × $6.00 -
×
 All in One Forex Course with VintagEducation
1 × $31.00
All in One Forex Course with VintagEducation
1 × $31.00 -
×
 The Indices Orderflow Masterclass with The Forex Scalpers
1 × $23.00
The Indices Orderflow Masterclass with The Forex Scalpers
1 × $23.00 -
×
 ACB Forex Trading Suite with ACB Forex Trading Solutions
1 × $6.00
ACB Forex Trading Suite with ACB Forex Trading Solutions
1 × $6.00 -
×
 Hot Commodities: How Anyone Can Invest Profitably in the World's Best Market with Jim Rogers
1 × $6.00
Hot Commodities: How Anyone Can Invest Profitably in the World's Best Market with Jim Rogers
1 × $6.00 -
×
 Mql4 Bundle: Basics, Scripts, Indicators, Experts with Jim Hodges
1 × $15.00
Mql4 Bundle: Basics, Scripts, Indicators, Experts with Jim Hodges
1 × $15.00 -
×
 Levines Guide to Spss for Analysis of Variance with Melanie Page, Sanford Braver & David Mackinnon
1 × $6.00
Levines Guide to Spss for Analysis of Variance with Melanie Page, Sanford Braver & David Mackinnon
1 × $6.00 -
×
 Managing Investment Portfolios (3rd Ed.) with John Maginn
1 × $6.00
Managing Investment Portfolios (3rd Ed.) with John Maginn
1 × $6.00 -
×
 Market Magic: Riding the Greatest Bull Market of the Century with Louise Yamada
1 × $6.00
Market Magic: Riding the Greatest Bull Market of the Century with Louise Yamada
1 × $6.00 -
×
 Super Conference 2020 - Premier Coaching Package with Vince Vora
1 × $109.00
Super Conference 2020 - Premier Coaching Package with Vince Vora
1 × $109.00 -
×
 W.D. Gann’s Secret Divergence Method with Hexatrade350
1 × $5.00
W.D. Gann’s Secret Divergence Method with Hexatrade350
1 × $5.00 -
×
 Advanced Option Trading with Broken Wing Butterflys with Greg Loehr
1 × $9.00
Advanced Option Trading with Broken Wing Butterflys with Greg Loehr
1 × $9.00 -
×
 WEBINAR series 5 – EXECUTION: A DETAILED PROCESS with FuturesTrader71
1 × $4.00
WEBINAR series 5 – EXECUTION: A DETAILED PROCESS with FuturesTrader71
1 × $4.00 -
×
 Active Investing courses notes with Alan Hull
1 × $6.00
Active Investing courses notes with Alan Hull
1 × $6.00 -
×
 Double Your Capital In 30 Days(2016) with GFA Flips
1 × $5.00
Double Your Capital In 30 Days(2016) with GFA Flips
1 × $5.00 -
×
 WondaFX Signature Strategy with WondaFX
1 × $5.00
WondaFX Signature Strategy with WondaFX
1 × $5.00 -
×
 OTC Oracle Course - PENNY WHALE with Simple Trade
1 × $31.00
OTC Oracle Course - PENNY WHALE with Simple Trade
1 × $31.00 -
×
 George Bayer Squarring the Circle for Excel
1 × $6.00
George Bayer Squarring the Circle for Excel
1 × $6.00 -
×
 White Phoenix’s The Smart (Money) Approach to Trading with Jayson Casper
1 × $39.00
White Phoenix’s The Smart (Money) Approach to Trading with Jayson Casper
1 × $39.00 -
×
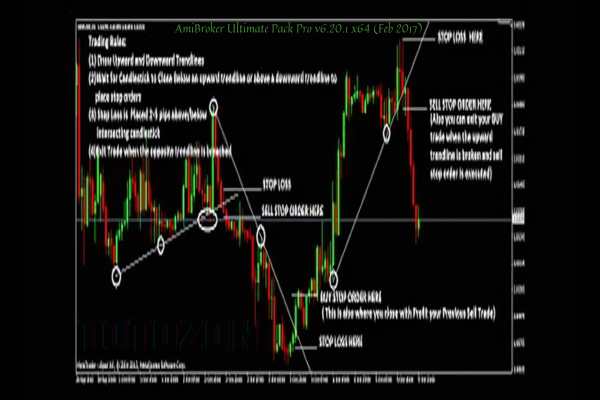 AmiBroker Ultimate Pack Pro v6.20.1 x64 (Feb 2017)
1 × $6.00
AmiBroker Ultimate Pack Pro v6.20.1 x64 (Feb 2017)
1 × $6.00 -
×
 Ultimate Trading Course with Dodgy's Dungeon
1 × $8.00
Ultimate Trading Course with Dodgy's Dungeon
1 × $8.00 -
×
 IBD Home Study Course Package with Investor's Business Daily
1 × $17.00
IBD Home Study Course Package with Investor's Business Daily
1 × $17.00 -
×
 WD Gann’s Master Time Factor DVD With Miles Wilson Walker
1 × $6.00
WD Gann’s Master Time Factor DVD With Miles Wilson Walker
1 × $6.00 -
×
 Options On Futures Class By Mark Fenton - Sheridan Options Mentoring
1 × $6.00
Options On Futures Class By Mark Fenton - Sheridan Options Mentoring
1 × $6.00 -
×
 Forex Education Trading System (Video 469 MB)
1 × $23.00
Forex Education Trading System (Video 469 MB)
1 × $23.00 -
×
 Algo Trading Masterclass with Ali Casey - StatOasis
1 × $23.00
Algo Trading Masterclass with Ali Casey - StatOasis
1 × $23.00 -
×
 SNR Trader Course with Ariff T
1 × $6.00
SNR Trader Course with Ariff T
1 × $6.00 -
×
 Power Charting - Robert’s Indicator Webinar
1 × $6.00
Power Charting - Robert’s Indicator Webinar
1 × $6.00 -
×
 Options, Futures & Other Derivatives . Solutions Manual
1 × $6.00
Options, Futures & Other Derivatives . Solutions Manual
1 × $6.00 -
×
 Complete Portfolio and Stock Comparison Spreadsheet with Joseph Hogue
1 × $6.00
Complete Portfolio and Stock Comparison Spreadsheet with Joseph Hogue
1 × $6.00 -
×
 Fibonacci Swing Trader 2.0 with Frank Paul - Forexmentor
1 × $6.00
Fibonacci Swing Trader 2.0 with Frank Paul - Forexmentor
1 × $6.00 -
×
 HEDGED STRATEGY SERIES IN VOLATILE MARKETS – HEDGED CREDIT SPREADS - Dan Sheridan
1 × $6.00
HEDGED STRATEGY SERIES IN VOLATILE MARKETS – HEDGED CREDIT SPREADS - Dan Sheridan
1 × $6.00 -
×
 ETFs for the Long Run: What They Are, How They Work, and Simple Strategies for Successful Long-Term Investing - Lawrence Carrel
1 × $6.00
ETFs for the Long Run: What They Are, How They Work, and Simple Strategies for Successful Long-Term Investing - Lawrence Carrel
1 × $6.00 -
×
 Mastering High Probability Chart Reading Methods with John Murphy
1 × $6.00
Mastering High Probability Chart Reading Methods with John Murphy
1 × $6.00 -
×
 Small Stocks for Big Profits: Generate Spectacular Returns by Investing in Up-and-Coming Companies with George Angell
1 × $6.00
Small Stocks for Big Profits: Generate Spectacular Returns by Investing in Up-and-Coming Companies with George Angell
1 × $6.00 -
×
 Classic Trading Tactics Theory and Practice with Linda Raschke
1 × $13.00
Classic Trading Tactics Theory and Practice with Linda Raschke
1 × $13.00 -
×
 3 Short Selling Strategies - Trading Strategy Bundles – Quantified Strategies
1 × $39.00
3 Short Selling Strategies - Trading Strategy Bundles – Quantified Strategies
1 × $39.00 -
×
 4 Day Trading Bootcamp
1 × $31.00
4 Day Trading Bootcamp
1 × $31.00 -
×
 Technical Analysis for Long-Term Investors with Clay Allen
1 × $6.00
Technical Analysis for Long-Term Investors with Clay Allen
1 × $6.00 -
×
 All Time High Trading Course with TRADEVERSITY
1 × $5.00
All Time High Trading Course with TRADEVERSITY
1 × $5.00 -
×
 The EAP Training Program (Apr 2019)
1 × $6.00
The EAP Training Program (Apr 2019)
1 × $6.00 -
×
 Module I - Foundation with FX MindShift
1 × $6.00
Module I - Foundation with FX MindShift
1 × $6.00 -
×
 Investing in stocks: Avoid stock market loss
1 × $15.00
Investing in stocks: Avoid stock market loss
1 × $15.00 -
×
 Part-Time Day Trading Courses
1 × $54.00
Part-Time Day Trading Courses
1 × $54.00 -
×
 Back to the Basics
1 × $6.00
Back to the Basics
1 × $6.00 -
×
 How To Read The Market Professionally with TradeSmart
1 × $27.00
How To Read The Market Professionally with TradeSmart
1 × $27.00 -
×
 The BULLFx Forex Trading Course
1 × $5.00
The BULLFx Forex Trading Course
1 × $5.00 -
×
 Naked Trading Part 1 with Base Camp Trading
1 × $6.00
Naked Trading Part 1 with Base Camp Trading
1 × $6.00 -
×
 Blending Quantitative & Traditional Equity Analysis with CFA Institute
1 × $6.00
Blending Quantitative & Traditional Equity Analysis with CFA Institute
1 × $6.00 -
×
 Systems Trading for Spread Betting: An end-to-end guide for developing spread betting systems with Gary Ford
1 × $6.00
Systems Trading for Spread Betting: An end-to-end guide for developing spread betting systems with Gary Ford
1 × $6.00 -
×
 Climate Behaviour with Feibel Trading
1 × $6.00
Climate Behaviour with Feibel Trading
1 × $6.00 -
×
 The Realistic Trader - Crypto Currencies
1 × $31.00
The Realistic Trader - Crypto Currencies
1 × $31.00 -
×
 The Trader’s Book of Volume with Mark Leibovit
1 × $6.00
The Trader’s Book of Volume with Mark Leibovit
1 × $6.00 -
×
 Chaos. The New Map for Traders
1 × $15.00
Chaos. The New Map for Traders
1 × $15.00 -
×
 Measuring Market Risk (2nd Edition) with Kevin Dowd
1 × $6.00
Measuring Market Risk (2nd Edition) with Kevin Dowd
1 × $6.00 -
×
 Secret Income with James Altucher
1 × $62.00
Secret Income with James Altucher
1 × $62.00 -
×
 Forex Options Trading
1 × $6.00
Forex Options Trading
1 × $6.00 -
×
 Line In The Sand with Trick Trades
1 × $23.00
Line In The Sand with Trick Trades
1 × $23.00 -
×
 Trade Options Like a DPM with The Admiral Webinar Series with Hamzei Analytics
1 × $6.00
Trade Options Like a DPM with The Admiral Webinar Series with Hamzei Analytics
1 × $6.00 -
×
 AIME System Forex Trading Course
1 × $6.00
AIME System Forex Trading Course
1 × $6.00 -
×
 The Basics of the Wave Principle with Wayne Gorman
1 × $15.00
The Basics of the Wave Principle with Wayne Gorman
1 × $15.00 -
×
 Futures Spreads Crash Course with Base Camp Trading
1 × $54.00
Futures Spreads Crash Course with Base Camp Trading
1 × $54.00 -
×
 Crypto Trading Academy with Cheeky Investor - Aussie Day Trader
1 × $13.00
Crypto Trading Academy with Cheeky Investor - Aussie Day Trader
1 × $13.00 -
×
 The Reducing Risk and Maximizing Returns Blueprint (Atomic Hedge Strategy) with Don Kaufman
1 × $6.00
The Reducing Risk and Maximizing Returns Blueprint (Atomic Hedge Strategy) with Don Kaufman
1 × $6.00 -
×
 Master Forex Fundamentals
1 × $15.00
Master Forex Fundamentals
1 × $15.00 -
×
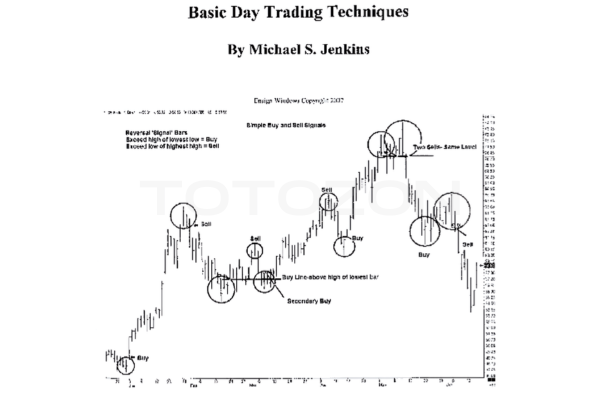 Basic Day Trading Techniques with Michael Jenkins
1 × $6.00
Basic Day Trading Techniques with Michael Jenkins
1 × $6.00 -
×
 Opening Bell Income Strategy with Todd Mitchell
1 × $54.00
Opening Bell Income Strategy with Todd Mitchell
1 × $54.00 -
×
 SWING TRADING WITH CONFIDENCE
1 × $31.00
SWING TRADING WITH CONFIDENCE
1 × $31.00 -
×
 KP Trading Room w/ Paladin and JadeCapFX
1 × $5.00
KP Trading Room w/ Paladin and JadeCapFX
1 × $5.00 -
×
 Tradeonix Trading System
1 × $31.00
Tradeonix Trading System
1 × $31.00 -
×
 The Newly Revised Hal Method of Cyclic Analysis with Walter Bressert
1 × $5.00
The Newly Revised Hal Method of Cyclic Analysis with Walter Bressert
1 × $5.00 -
×
 Bond Market Course with The Macro Compass
1 × $15.00
Bond Market Course with The Macro Compass
1 × $15.00

Reading & Understanding Charts with Andrew Baxter
$6.00
File Size: 311MB
Delivery Time: 1–12 hours
Media Type: Online Course
Content Proof: Watch Here!
You may check content proof of “Reading & Understanding Chartsb with Andrew Baxter” below:

Reading & Understanding Charts with Andrew Baxter
Introduction to Chart Reading
Charts are essential tools for traders, providing visual representations of market data. Andrew Baxter, a renowned trader and educator, shares his expertise on how to read and understand charts effectively. This article will guide you through the basics and advanced techniques of chart reading, helping you make informed trading decisions.
What are Trading Charts?
Definition and Purpose
Trading charts are graphical representations of price movements over time. They help traders analyze trends, identify patterns, and make predictions about future price movements.
Importance of Chart Reading
Understanding charts is crucial for making data-driven decisions in trading. It reduces emotional trading and enhances your ability to spot opportunities and risks.
Types of Trading Charts
1. Line Charts
Line charts are the simplest form of trading charts, showing the closing prices over a period. They provide a clear view of the overall trend but lack detailed information.
2. Bar Charts
Bar charts display the opening, closing, high, and low prices for each period. They offer more information than line charts and help in understanding price volatility.
3. Candlestick Charts
Candlestick charts are popular due to their detailed and visually appealing format. Each candlestick shows the opening, closing, high, and low prices, making it easier to identify market sentiment.
Understanding Candlestick Charts
Components of a Candlestick
- Body: The filled part showing the opening and closing prices.
- Wicks/Shadows: The thin lines representing the high and low prices.
- Color: Indicates whether the closing price was higher (typically green) or lower (typically red) than the opening price.
Common Candlestick Patterns
1. Doji
A Doji occurs when the opening and closing prices are nearly the same, indicating indecision in the market.
2. Hammer
A Hammer has a small body with a long lower wick, suggesting a potential reversal from a downtrend.
3. Engulfing Pattern
An Engulfing pattern occurs when a larger candlestick completely engulfs the previous smaller candlestick, signaling a potential reversal.
Key Chart Patterns
1. Head and Shoulders
This pattern indicates a reversal and is formed by a peak (head) flanked by two smaller peaks (shoulders).
2. Double Top and Double Bottom
These patterns signal a potential reversal. A double top indicates a bearish reversal, while a double bottom suggests a bullish reversal.
3. Triangles
Triangles are continuation patterns that show a period of consolidation before the price continues in the direction of the previous trend.
Using Technical Indicators
1. Moving Averages
Moving averages smooth out price data to identify trends. Common types include Simple Moving Average (SMA) and Exponential Moving Average (EMA).
2. Relative Strength Index (RSI)
RSI measures the speed and change of price movements, indicating overbought or oversold conditions.
3. Moving Average Convergence Divergence (MACD)
MACD shows the relationship between two moving averages, helping to identify potential buy and sell signals.
Combining Chart Patterns and Indicators
Integrated Analysis
Combining chart patterns with technical indicators enhances the reliability of trading signals. For example, confirming a head and shoulders pattern with RSI divergence can provide a stronger signal.
Practical Application
Use a combination of patterns and indicators to develop a comprehensive trading strategy. This approach helps in making more informed and confident trading decisions.
Advanced Chart Reading Techniques
1. Fibonacci Retracement
Fibonacci retracement levels indicate potential support and resistance levels based on the Fibonacci sequence.
2. Volume Analysis
Volume analysis involves examining the number of shares traded to confirm the strength of a price movement or trend.
3. Divergence
Divergence occurs when the price moves in the opposite direction of an indicator, signaling a potential reversal.
Common Mistakes in Chart Reading
1. Overcomplicating Analysis
Avoid using too many indicators and patterns at once. Focus on a few reliable tools to keep your analysis clear and effective.
2. Ignoring Context
Always consider the broader market context and economic factors. Relying solely on charts without context can lead to misleading conclusions.
3. Emotional Trading
Stick to your analysis and avoid making decisions based on emotions. Emotional trading can undermine even the best chart reading skills.
Benefits of Mastering Chart Reading
1. Improved Decision Making
Accurate chart reading helps you make informed decisions, reducing the risk of losses and increasing the potential for gains.
2. Enhanced Trading Strategy
Understanding charts allows you to develop and refine your trading strategies, making them more effective and adaptable.
3. Increased Confidence
With better chart reading skills, you gain confidence in your trading decisions, leading to more consistent performance.
Conclusion
Reading and understanding charts with insights from Andrew Baxter can significantly improve your trading performance. By mastering various chart types, patterns, and technical indicators, you can make more informed decisions and develop robust trading strategies. Embrace these principles, continuously practice, and refine your skills to become a proficient trader.
Frequently Asked Questions:
What are the main types of trading charts?
The main types are line charts, bar charts, and candlestick charts.
Why are candlestick charts popular?
Candlestick charts are popular due to their detailed and visually appealing format, making it easier to identify market sentiment.
What are some common candlestick patterns?
Common patterns include Doji, Hammer, and Engulfing patterns.
How can technical indicators enhance chart reading?
Technical indicators like moving averages, RSI, and MACD help identify trends, momentum, and potential buy/sell signals.
What are some advanced chart reading techniques?
Advanced techniques include Fibonacci retracement, volume analysis, and divergence.
Be the first to review “Reading & Understanding Charts with Andrew Baxter”
You must be logged in to post a review.
Related products

Original price was: $895.00.$15.00Current price is: $15.00.
Forex Trading
Original price was: $125.00.$17.00Current price is: $17.00.

Forex Trading
Original price was: $797.00.$10.00Current price is: $10.00.
Original price was: $450.00.$23.00Current price is: $23.00.
Original price was: $799.00.$15.00Current price is: $15.00.

Original price was: $139.00.$23.00Current price is: $23.00.

Original price was: $997.00.$8.00Current price is: $8.00.

Forex Trading
Quantamentals – The Next Great Forefront Of Trading and Investing with Trading Markets
Original price was: $1,495.00.$8.00Current price is: $8.00.

Original price was: $1,849.00.$15.00Current price is: $15.00.

Original price was: $1,800.00.$54.00Current price is: $54.00.

Original price was: $197.00.$5.00Current price is: $5.00.
Forex Trading
Original price was: $550.00.$5.00Current price is: $5.00.

Original price was: $999.00.$5.00Current price is: $5.00.

Forex Trading
Original price was: $249.00.$15.00Current price is: $15.00.

Original price was: $4,995.00.$15.00Current price is: $15.00.

Forex Trading
Original price was: $799.00.$15.00Current price is: $15.00.

Original price was: $1,200.00.$23.00Current price is: $23.00.

Original price was: $695.00.$41.00Current price is: $41.00.

Forex Trading
Original price was: $1,098.00.$39.00Current price is: $39.00.
Forex Trading
Original price was: $239.00.$8.00Current price is: $8.00.

Reviews
There are no reviews yet.