-
×
 Pre-Previews. 23 Articles and Forecasts
1 × $6.00
Pre-Previews. 23 Articles and Forecasts
1 × $6.00 -
×
 Module IV - Day Trading to Short Term Swing Trades with FX MindShift
1 × $6.00
Module IV - Day Trading to Short Term Swing Trades with FX MindShift
1 × $6.00 -
×
 ART Online 4 Weeks Home Study Course with Bennett McDowell
1 × $78.00
ART Online 4 Weeks Home Study Course with Bennett McDowell
1 × $78.00 -
×
 The Active Investor Blueprint with Steve Nison - Candle Charts
1 × $23.00
The Active Investor Blueprint with Steve Nison - Candle Charts
1 × $23.00 -
×
 FOREX GENERATION MASTER COURSE
1 × $6.00
FOREX GENERATION MASTER COURSE
1 × $6.00 -
×
 The Sweep Show with Scott Pulcini Trader
1 × $23.00
The Sweep Show with Scott Pulcini Trader
1 × $23.00 -
×
 The Indices Orderflow Masterclass with The Forex Scalpers
1 × $23.00
The Indices Orderflow Masterclass with The Forex Scalpers
1 × $23.00 -
×
 Quantamentals - The Next Great Forefront Of Trading and Investing with Trading Markets
1 × $8.00
Quantamentals - The Next Great Forefront Of Trading and Investing with Trading Markets
1 × $8.00 -
×
 Foolproof Forex Trading with Louise Woof
1 × $6.00
Foolproof Forex Trading with Louise Woof
1 × $6.00 -
×
 Trading From Your Gut with Curtis Faith
1 × $6.00
Trading From Your Gut with Curtis Faith
1 × $6.00 -
×
 Precision Timing Your Options Trades Using Fibonacci with Trading Analysis
1 × $15.00
Precision Timing Your Options Trades Using Fibonacci with Trading Analysis
1 × $15.00 -
×
 Guide to Winning with Automated Trading Systems with Jack Schwager
1 × $6.00
Guide to Winning with Automated Trading Systems with Jack Schwager
1 × $6.00 -
×
 Ultimate Trading Course with Dodgy's Dungeon
1 × $8.00
Ultimate Trading Course with Dodgy's Dungeon
1 × $8.00 -
×
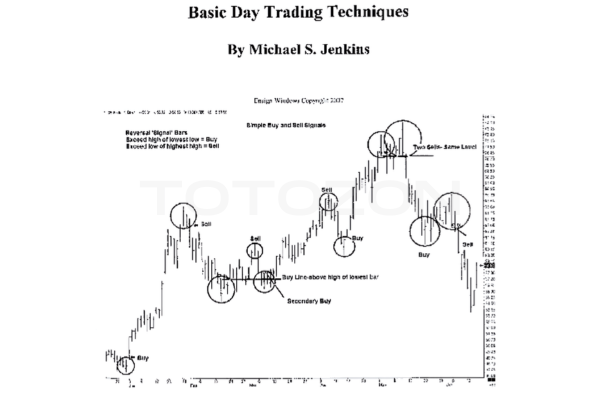 Basic Day Trading Techniques with Michael Jenkins
1 × $6.00
Basic Day Trading Techniques with Michael Jenkins
1 × $6.00 -
×
 Unreal Series - Forex Trading Master - Surreal Abilities with Talmadge Harper - Harper Healing
1 × $8.00
Unreal Series - Forex Trading Master - Surreal Abilities with Talmadge Harper - Harper Healing
1 × $8.00 -
×
 Stock Cycles with Michael Alexander
1 × $6.00
Stock Cycles with Michael Alexander
1 × $6.00 -
×
 Stock Trading Strategies Technical Analysis MasterClass 2 with Jyoti Bansal
1 × $6.00
Stock Trading Strategies Technical Analysis MasterClass 2 with Jyoti Bansal
1 × $6.00 -
×
 The STRAT Execution Basics with Jermaine McGruder
1 × $31.00
The STRAT Execution Basics with Jermaine McGruder
1 × $31.00 -
×
 Daryl Guppy Tutorials In Technical Analysis (2000-2001-2003-2004)
1 × $6.00
Daryl Guppy Tutorials In Technical Analysis (2000-2001-2003-2004)
1 × $6.00 -
×
 The Big Picture Collection with Barbara Rockefeller
1 × $6.00
The Big Picture Collection with Barbara Rockefeller
1 × $6.00 -
×
 Letal Forex System with Alex Seeni
1 × $6.00
Letal Forex System with Alex Seeni
1 × $6.00 -
×
 AstroFX Course
1 × $6.00
AstroFX Course
1 × $6.00 -
×
 Maximum Lots Trading Course with Joe Wright
1 × $34.00
Maximum Lots Trading Course with Joe Wright
1 × $34.00 -
×
 Professional Trader Series DVD Set (Full)
1 × $23.00
Professional Trader Series DVD Set (Full)
1 × $23.00 -
×
 Basecamptrading - How to Become a More Consistent Trader
1 × $15.00
Basecamptrading - How to Become a More Consistent Trader
1 × $15.00 -
×
 E-Bonds: An Introduction to the Online Bond Market with Jake Wengroff
1 × $6.00
E-Bonds: An Introduction to the Online Bond Market with Jake Wengroff
1 × $6.00 -
×
 Forex Trading Advice & Intro to The Natural Flow
1 × $6.00
Forex Trading Advice & Intro to The Natural Flow
1 × $6.00 -
×
 GANNacci Code Elite + Training Course
1 × $31.00
GANNacci Code Elite + Training Course
1 × $31.00 -
×
 AI For Traders with Trading Markets
1 × $31.00
AI For Traders with Trading Markets
1 × $31.00 -
×
 Trading The Hobbs Triple Crown Strategy with Derrik Hobbs
1 × $6.00
Trading The Hobbs Triple Crown Strategy with Derrik Hobbs
1 × $6.00 -
×
 Technical Analysis 201: From Chart Setups to Trading Execution Methodology Class with Jeff Bierman
1 × $6.00
Technical Analysis 201: From Chart Setups to Trading Execution Methodology Class with Jeff Bierman
1 × $6.00 -
×
 Successful Stock Speculation (1922) with John James
1 × $6.00
Successful Stock Speculation (1922) with John James
1 × $6.00 -
×
 Generative AI for Asset Managers Workshop Recording with Ernest Chan
1 × $55.00
Generative AI for Asset Managers Workshop Recording with Ernest Chan
1 × $55.00 -
×
 Forecast for 2010 with Larry Williams
1 × $6.00
Forecast for 2010 with Larry Williams
1 × $6.00 -
×
 Investing in 401k Plans with Cliffsnotes
1 × $6.00
Investing in 401k Plans with Cliffsnotes
1 × $6.00 -
×
 Building Winning Trading Systems
1 × $6.00
Building Winning Trading Systems
1 × $6.00 -
×
 Portfolio Investing with Ron Bertino
1 × $54.00
Portfolio Investing with Ron Bertino
1 × $54.00 -
×
 Best of the Best: Collars with Amy Meissner & Scott Ruble
1 × $15.00
Best of the Best: Collars with Amy Meissner & Scott Ruble
1 × $15.00 -
×
 Set and Forget with Alex Gonzalez - Swing Trading Lab
1 × $5.00
Set and Forget with Alex Gonzalez - Swing Trading Lab
1 × $5.00 -
×
 FXJake Webinars with Walter Peters
1 × $6.00
FXJake Webinars with Walter Peters
1 × $6.00 -
×
![Strike Zone Trading - Forex Course [81 Videos (MP4) + 96 Software files (EXEEX4MQ4CHRWNDTPL) + 17 DOCS (TXTCSVXLSXPDF) + Images (PNGJPGGIF)]](https://www.totozon.com/wp-content/uploads/2024/05/Strike-Zone-Trading-Forex-Course-81-Videos-MP4-96-Software-files-EXEEX4MQ4CHRWNDTPL-17-DOCS-TXTCSVXLSXPDF-Images-PNGJPGGIF.jpg) Strike Zone Trading - Forex Course [81 Videos (MP4) + 96 Software files (EXE/EX4/MQ4/CHR/WND/TPL) + 17 DOCS (TXT/CSV/XLSX/PDF) + Images (PNG/JPG/GIF)]
1 × $6.00
Strike Zone Trading - Forex Course [81 Videos (MP4) + 96 Software files (EXE/EX4/MQ4/CHR/WND/TPL) + 17 DOCS (TXT/CSV/XLSX/PDF) + Images (PNG/JPG/GIF)]
1 × $6.00 -
×
 Sacredscience - Sepharial – Your Personal Diurnal Chart
1 × $6.00
Sacredscience - Sepharial – Your Personal Diurnal Chart
1 × $6.00 -
×
 SMT FX Trading
1 × $5.00
SMT FX Trading
1 × $5.00 -
×
 Developing Profitable Systems from Discretionary to Mechanical with Fred Shutzman
1 × $6.00
Developing Profitable Systems from Discretionary to Mechanical with Fred Shutzman
1 × $6.00 -
×
 The Risk-Wise Investor: How to Better Understand and Manage Risk with Michael Carpenter
1 × $6.00
The Risk-Wise Investor: How to Better Understand and Manage Risk with Michael Carpenter
1 × $6.00 -
×
 DAY TRADING OPTIONS For Beginners: Strategies to INVEST and WIN with Dylan Parker
1 × $5.00
DAY TRADING OPTIONS For Beginners: Strategies to INVEST and WIN with Dylan Parker
1 × $5.00 -
×
 The Market Geometry Basic Seminar DVD with Market Geometry
1 × $31.00
The Market Geometry Basic Seminar DVD with Market Geometry
1 × $31.00 -
×
 Computerized Trading with Mark Jurik
1 × $6.00
Computerized Trading with Mark Jurik
1 × $6.00 -
×
 Duxinator: High Odds Penny Trading Presented with Steven Dux
1 × $6.00
Duxinator: High Odds Penny Trading Presented with Steven Dux
1 × $6.00 -
×
 Directional Calendars in 2023 with Dan Sheridan & Mark Fenton - Sheridan Options Mentoring
1 × $85.00
Directional Calendars in 2023 with Dan Sheridan & Mark Fenton - Sheridan Options Mentoring
1 × $85.00 -
×
 Power Combo with Random Walk Trading
1 × $15.00
Power Combo with Random Walk Trading
1 × $15.00 -
×
 Lessons From A Trader’s Camp. Winning Psychology & Tactics with Alexander Elder
1 × $6.00
Lessons From A Trader’s Camp. Winning Psychology & Tactics with Alexander Elder
1 × $6.00 -
×
 Asset Markets, Portfolio Choice and Macroeconomic Activity: A Keynesian Perspective - Toichiro Asadra, Peter Flaschel, Tarik Mouakil & Christian Proaño
1 × $6.00
Asset Markets, Portfolio Choice and Macroeconomic Activity: A Keynesian Perspective - Toichiro Asadra, Peter Flaschel, Tarik Mouakil & Christian Proaño
1 × $6.00 -
×
 Essentials Of Payroll Management & Accounting with Steven M.Bragg
1 × $6.00
Essentials Of Payroll Management & Accounting with Steven M.Bragg
1 × $6.00 -
×
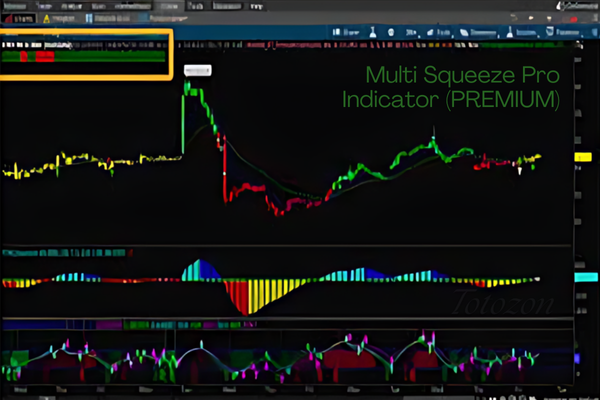 Multi Squeeze Pro Indicator (PREMIUM)
1 × $69.00
Multi Squeeze Pro Indicator (PREMIUM)
1 × $69.00 -
×
 The Gold Standard in Trading Education with Six Figure Capital
1 × $5.00
The Gold Standard in Trading Education with Six Figure Capital
1 × $5.00 -
×
 Computerized Trading. Maximizing Day Trading and Overnight Profits with Mark Jurik
1 × $6.00
Computerized Trading. Maximizing Day Trading and Overnight Profits with Mark Jurik
1 × $6.00 -
×
 From Zero to Trading e-Book with Jermaine McGruder
1 × $15.00
From Zero to Trading e-Book with Jermaine McGruder
1 × $15.00 -
×
 Trading Full Circle the Complete Underground Trader System for Timing with Jea Yu
1 × $6.00
Trading Full Circle the Complete Underground Trader System for Timing with Jea Yu
1 × $6.00 -
×
 Market Forecasting. Stocks and Grain
1 × $6.00
Market Forecasting. Stocks and Grain
1 × $6.00 -
×
 Corruption and Reform: Lessons from America's Economic History with Edward Glaeser & Claudia Goldin
1 × $6.00
Corruption and Reform: Lessons from America's Economic History with Edward Glaeser & Claudia Goldin
1 × $6.00 -
×
 Charting the Major Forex Pairs: Focus on Major Currencies with James Bickford
1 × $6.00
Charting the Major Forex Pairs: Focus on Major Currencies with James Bickford
1 × $6.00 -
×
 The Market Matrix
1 × $6.00
The Market Matrix
1 × $6.00 -
×
 Ichimoku Cloud Trading System Class with Jeff Bierman
1 × $6.00
Ichimoku Cloud Trading System Class with Jeff Bierman
1 × $6.00 -
×
 The New Goldrush Of 2021 with Keith Dougherty
1 × $46.00
The New Goldrush Of 2021 with Keith Dougherty
1 × $46.00 -
×
 Carter FX 2.0 with CFX University
1 × $5.00
Carter FX 2.0 with CFX University
1 × $5.00 -
×
 The Offshore Money Book with Arnold Cornez
1 × $6.00
The Offshore Money Book with Arnold Cornez
1 × $6.00 -
×
 Day Trading Freedom Course & Members Area Videos
1 × $6.00
Day Trading Freedom Course & Members Area Videos
1 × $6.00 -
×
 The Prop Trading Code with Brannigan Barrett - Axia Futures
1 × $23.00
The Prop Trading Code with Brannigan Barrett - Axia Futures
1 × $23.00 -
×
 How To Invest Better
1 × $6.00
How To Invest Better
1 × $6.00 -
×
 Money Management Strategies for Serious Traders with David Stendahl
1 × $6.00
Money Management Strategies for Serious Traders with David Stendahl
1 × $6.00 -
×
 Annual Forecast Reports - Forecast 2023 with Larry Williams
1 × $8.00
Annual Forecast Reports - Forecast 2023 with Larry Williams
1 × $8.00 -
×
 Mastering Income Spread Trading with Dave Aquino - Base Camp Trading
1 × $23.00
Mastering Income Spread Trading with Dave Aquino - Base Camp Trading
1 × $23.00 -
×
 New Blueprints for Gains in Stocks and Grains & One-Way Formula for Trading in Stocks and Commodities (Traders' Masterclass) - William Dunnigan
1 × $6.00
New Blueprints for Gains in Stocks and Grains & One-Way Formula for Trading in Stocks and Commodities (Traders' Masterclass) - William Dunnigan
1 × $6.00 -
×
 The HV7 Option Trading System with Amy Meissner – Aeromir
1 × $8.00
The HV7 Option Trading System with Amy Meissner – Aeromir
1 × $8.00 -
×
 The Complete Guide to Option Selling, 2nd 2009 with James Cordier & Michael Gross
1 × $6.00
The Complete Guide to Option Selling, 2nd 2009 with James Cordier & Michael Gross
1 × $6.00 -
×
 Short Term Trading. Integrated Pithfork Analysis with Dr. Mircea Dologa
1 × $6.00
Short Term Trading. Integrated Pithfork Analysis with Dr. Mircea Dologa
1 × $6.00 -
×
 6-2-4 Winning Strategies & Systems with Jack Bernstein
1 × $6.00
6-2-4 Winning Strategies & Systems with Jack Bernstein
1 × $6.00 -
×
 Credit Spreads Deep Dive with Jay Bailey - Sheridan Options Mentoring
1 × $31.00
Credit Spreads Deep Dive with Jay Bailey - Sheridan Options Mentoring
1 × $31.00 -
×
 Forex Made Easy: 6 Ways to Trade the Dollar with James Dicks
1 × $6.00
Forex Made Easy: 6 Ways to Trade the Dollar with James Dicks
1 × $6.00 -
×
 Gann’s Scientific Methods Unveiled (Vol I, II)
1 × $6.00
Gann’s Scientific Methods Unveiled (Vol I, II)
1 × $6.00 -
×
 Quantifiable Edges Swing Trading Course with Quantifiable Edges
1 × $15.00
Quantifiable Edges Swing Trading Course with Quantifiable Edges
1 × $15.00 -
×
 MACK - PATS Simple ES Scalping Strategy
1 × $15.00
MACK - PATS Simple ES Scalping Strategy
1 × $15.00 -
×
 CM APR (A Pivot Reverse) Trade Method with Austin Passamonte
1 × $6.00
CM APR (A Pivot Reverse) Trade Method with Austin Passamonte
1 × $6.00 -
×
 Setups of a Winning Trader with Gareth Soloway
1 × $521.00
Setups of a Winning Trader with Gareth Soloway
1 × $521.00 -
×
 Cycle Hunter Books 1-3 with Brian James Sklenka
1 × $6.00
Cycle Hunter Books 1-3 with Brian James Sklenka
1 × $6.00 -
×
 Best Trading Set Ups Playbook with Stacey Burke Trading
1 × $5.00
Best Trading Set Ups Playbook with Stacey Burke Trading
1 × $5.00 -
×
 The Futures Edge with Joshua Martinez
1 × $155.00
The Futures Edge with Joshua Martinez
1 × $155.00 -
×
 Bond Market Course with The Macro Compass
1 × $15.00
Bond Market Course with The Macro Compass
1 × $15.00 -
×
 Investment Science with David G.Luenberger
1 × $6.00
Investment Science with David G.Luenberger
1 × $6.00 -
×
 Trading Academy 2024 with Tradeciety
1 × $5.00
Trading Academy 2024 with Tradeciety
1 × $5.00 -
×
 CFA Level 1 - Schweser Study Notes 2006 (schweser.com)
1 × $6.00
CFA Level 1 - Schweser Study Notes 2006 (schweser.com)
1 × $6.00 -
×
 Technical Timing Patterns
1 × $6.00
Technical Timing Patterns
1 × $6.00 -
×
 Forex Trading Systems Elearning Course - Busted Breakout System with Van Tharp
1 × $6.00
Forex Trading Systems Elearning Course - Busted Breakout System with Van Tharp
1 × $6.00

Reading & Understanding Charts with Andrew Baxter
$6.00
File Size: 311MB
Delivery Time: 1–12 hours
Media Type: Online Course
Content Proof: Watch Here!
You may check content proof of “Reading & Understanding Chartsb with Andrew Baxter” below:

Reading & Understanding Charts with Andrew Baxter
Introduction to Chart Reading
Charts are essential tools for traders, providing visual representations of market data. Andrew Baxter, a renowned trader and educator, shares his expertise on how to read and understand charts effectively. This article will guide you through the basics and advanced techniques of chart reading, helping you make informed trading decisions.
What are Trading Charts?
Definition and Purpose
Trading charts are graphical representations of price movements over time. They help traders analyze trends, identify patterns, and make predictions about future price movements.
Importance of Chart Reading
Understanding charts is crucial for making data-driven decisions in trading. It reduces emotional trading and enhances your ability to spot opportunities and risks.
Types of Trading Charts
1. Line Charts
Line charts are the simplest form of trading charts, showing the closing prices over a period. They provide a clear view of the overall trend but lack detailed information.
2. Bar Charts
Bar charts display the opening, closing, high, and low prices for each period. They offer more information than line charts and help in understanding price volatility.
3. Candlestick Charts
Candlestick charts are popular due to their detailed and visually appealing format. Each candlestick shows the opening, closing, high, and low prices, making it easier to identify market sentiment.
Understanding Candlestick Charts
Components of a Candlestick
- Body: The filled part showing the opening and closing prices.
- Wicks/Shadows: The thin lines representing the high and low prices.
- Color: Indicates whether the closing price was higher (typically green) or lower (typically red) than the opening price.
Common Candlestick Patterns
1. Doji
A Doji occurs when the opening and closing prices are nearly the same, indicating indecision in the market.
2. Hammer
A Hammer has a small body with a long lower wick, suggesting a potential reversal from a downtrend.
3. Engulfing Pattern
An Engulfing pattern occurs when a larger candlestick completely engulfs the previous smaller candlestick, signaling a potential reversal.
Key Chart Patterns
1. Head and Shoulders
This pattern indicates a reversal and is formed by a peak (head) flanked by two smaller peaks (shoulders).
2. Double Top and Double Bottom
These patterns signal a potential reversal. A double top indicates a bearish reversal, while a double bottom suggests a bullish reversal.
3. Triangles
Triangles are continuation patterns that show a period of consolidation before the price continues in the direction of the previous trend.
Using Technical Indicators
1. Moving Averages
Moving averages smooth out price data to identify trends. Common types include Simple Moving Average (SMA) and Exponential Moving Average (EMA).
2. Relative Strength Index (RSI)
RSI measures the speed and change of price movements, indicating overbought or oversold conditions.
3. Moving Average Convergence Divergence (MACD)
MACD shows the relationship between two moving averages, helping to identify potential buy and sell signals.
Combining Chart Patterns and Indicators
Integrated Analysis
Combining chart patterns with technical indicators enhances the reliability of trading signals. For example, confirming a head and shoulders pattern with RSI divergence can provide a stronger signal.
Practical Application
Use a combination of patterns and indicators to develop a comprehensive trading strategy. This approach helps in making more informed and confident trading decisions.
Advanced Chart Reading Techniques
1. Fibonacci Retracement
Fibonacci retracement levels indicate potential support and resistance levels based on the Fibonacci sequence.
2. Volume Analysis
Volume analysis involves examining the number of shares traded to confirm the strength of a price movement or trend.
3. Divergence
Divergence occurs when the price moves in the opposite direction of an indicator, signaling a potential reversal.
Common Mistakes in Chart Reading
1. Overcomplicating Analysis
Avoid using too many indicators and patterns at once. Focus on a few reliable tools to keep your analysis clear and effective.
2. Ignoring Context
Always consider the broader market context and economic factors. Relying solely on charts without context can lead to misleading conclusions.
3. Emotional Trading
Stick to your analysis and avoid making decisions based on emotions. Emotional trading can undermine even the best chart reading skills.
Benefits of Mastering Chart Reading
1. Improved Decision Making
Accurate chart reading helps you make informed decisions, reducing the risk of losses and increasing the potential for gains.
2. Enhanced Trading Strategy
Understanding charts allows you to develop and refine your trading strategies, making them more effective and adaptable.
3. Increased Confidence
With better chart reading skills, you gain confidence in your trading decisions, leading to more consistent performance.
Conclusion
Reading and understanding charts with insights from Andrew Baxter can significantly improve your trading performance. By mastering various chart types, patterns, and technical indicators, you can make more informed decisions and develop robust trading strategies. Embrace these principles, continuously practice, and refine your skills to become a proficient trader.
Frequently Asked Questions:
What are the main types of trading charts?
The main types are line charts, bar charts, and candlestick charts.
Why are candlestick charts popular?
Candlestick charts are popular due to their detailed and visually appealing format, making it easier to identify market sentiment.
What are some common candlestick patterns?
Common patterns include Doji, Hammer, and Engulfing patterns.
How can technical indicators enhance chart reading?
Technical indicators like moving averages, RSI, and MACD help identify trends, momentum, and potential buy/sell signals.
What are some advanced chart reading techniques?
Advanced techniques include Fibonacci retracement, volume analysis, and divergence.
Be the first to review “Reading & Understanding Charts with Andrew Baxter”
You must be logged in to post a review.
Related products

Forex Trading
Original price was: $850.00.$23.00Current price is: $23.00.

Original price was: $2,120.00.$15.00Current price is: $15.00.
Forex Trading
Original price was: $2,995.00.$31.00Current price is: $31.00.

Original price was: $497.00.$31.00Current price is: $31.00.

Forex Trading
Original price was: $2,997.00.$23.00Current price is: $23.00.

Forex Trading
Original price was: $2,000.00.$23.00Current price is: $23.00.

Original price was: $895.00.$15.00Current price is: $15.00.

Original price was: $695.00.$41.00Current price is: $41.00.

Original price was: $1,849.00.$15.00Current price is: $15.00.

Original price was: $139.00.$23.00Current price is: $23.00.

Original price was: $299.00.$8.00Current price is: $8.00.

Forex Trading
Original price was: $397.00.$31.00Current price is: $31.00.

Forex Trading
Original price was: $4,997.00.$27.00Current price is: $27.00.

Forex Trading
Original price was: $550.00.$5.00Current price is: $5.00.

Original price was: $649.00.$20.00Current price is: $20.00.

Original price was: $497.00.$11.00Current price is: $11.00.
Original price was: $1,200.00.$23.00Current price is: $23.00.

Original price was: $197.00.$5.00Current price is: $5.00.

Forex Trading
Original price was: $249.00.$15.00Current price is: $15.00.

Original price was: $4,995.00.$15.00Current price is: $15.00.

Reviews
There are no reviews yet.