-
×
 How to Spot a Trade Before it Happens (marketsmastered.com) with Markets Mastered
1 × $6.00
How to Spot a Trade Before it Happens (marketsmastered.com) with Markets Mastered
1 × $6.00 -
×
 The Indices Orderflow Masterclass with The Forex Scalpers
1 × $23.00
The Indices Orderflow Masterclass with The Forex Scalpers
1 × $23.00 -
×
 Volume Profile Video Course with Trader Dale
1 × $8.00
Volume Profile Video Course with Trader Dale
1 × $8.00 -
×
 Market Magic: Riding the Greatest Bull Market of the Century with Louise Yamada
1 × $6.00
Market Magic: Riding the Greatest Bull Market of the Century with Louise Yamada
1 × $6.00 -
×
 The Banks Code with Smart Money Trader
1 × $34.00
The Banks Code with Smart Money Trader
1 × $34.00 -
×
 Mastermind Bootcamp + Core Concepts Mastery with DreamsFX
1 × $6.00
Mastermind Bootcamp + Core Concepts Mastery with DreamsFX
1 × $6.00 -
×
 The Orderflow Masterclass with PrimeTrading
1 × $17.00
The Orderflow Masterclass with PrimeTrading
1 × $17.00 -
×
 Ultimate Trading Course with Dodgy's Dungeon
1 × $8.00
Ultimate Trading Course with Dodgy's Dungeon
1 × $8.00 -
×
 Evidence Based Technical Analysis with David Aronson
1 × $6.00
Evidence Based Technical Analysis with David Aronson
1 × $6.00 -
×
 A Day Trading Guide
1 × $54.00
A Day Trading Guide
1 × $54.00 -
×
 Mindover Markets Enhanced: The Intensive Series 2 with Jim Dalton
1 × $20.00
Mindover Markets Enhanced: The Intensive Series 2 with Jim Dalton
1 × $20.00 -
×
 Master Fibonacci, Symmetry & Consistent Profitable Trading with Day Trading Zones
1 × $23.00
Master Fibonacci, Symmetry & Consistent Profitable Trading with Day Trading Zones
1 × $23.00 -
×
 Scanning For Gold with Doug Sutton
1 × $6.00
Scanning For Gold with Doug Sutton
1 × $6.00 -
×
 Daryl Guppy Tutorials In Technical Analysis (2000-2001-2003-2004)
1 × $6.00
Daryl Guppy Tutorials In Technical Analysis (2000-2001-2003-2004)
1 × $6.00 -
×
 Optionetics Trading Strategies
1 × $5.00
Optionetics Trading Strategies
1 × $5.00 -
×
 Foolproof Forex Trading with Louise Woof
1 × $6.00
Foolproof Forex Trading with Louise Woof
1 × $6.00 -
×
 The Basics of the Wave Principle with Wayne Gorman
1 × $15.00
The Basics of the Wave Principle with Wayne Gorman
1 × $15.00 -
×
 Open Trader Pro Training
1 × $23.00
Open Trader Pro Training
1 × $23.00 -
×
 Theo Trade - 128 Course Bundle
1 × $93.00
Theo Trade - 128 Course Bundle
1 × $93.00 -
×
 Essential Stock Picking Strategies with Daniel Strachman
1 × $6.00
Essential Stock Picking Strategies with Daniel Strachman
1 × $6.00 -
×
 Managing Risk in Alternative Investment Strategies with Lars Jaeger
1 × $6.00
Managing Risk in Alternative Investment Strategies with Lars Jaeger
1 × $6.00 -
×
 How to Make Money in the Futures Market … and Lots of It with Charles Drummond
1 × $6.00
How to Make Money in the Futures Market … and Lots of It with Charles Drummond
1 × $6.00 -
×
 Forex Eye
1 × $5.00
Forex Eye
1 × $5.00 -
×
 Advanced Trading Course with DovyFX
1 × $5.00
Advanced Trading Course with DovyFX
1 × $5.00 -
×
 Trade Like a Pro in Currency Trading with Don Schellenberg
1 × $6.00
Trade Like a Pro in Currency Trading with Don Schellenberg
1 × $6.00 -
×
 Module IV - Day Trading to Short Term Swing Trades with FX MindShift
1 × $6.00
Module IV - Day Trading to Short Term Swing Trades with FX MindShift
1 × $6.00 -
×
 Restore & Enhance Your Biofield (Advanced) by Spirituality Zone
1 × $15.40
Restore & Enhance Your Biofield (Advanced) by Spirituality Zone
1 × $15.40 -
×
 Stock Market–Swing Trading Strategies for Wall Street with Bill Wermin
1 × $6.00
Stock Market–Swing Trading Strategies for Wall Street with Bill Wermin
1 × $6.00 -
×
 Trading Strategies for Capital Markets with Joseph Benning
1 × $6.00
Trading Strategies for Capital Markets with Joseph Benning
1 × $6.00 -
×
 Charting Made Easy with John J.Murphy
1 × $6.00
Charting Made Easy with John J.Murphy
1 × $6.00 -
×
 Advanced Option Trading with Broken Wing Butterflys with Greg Loehr
1 × $9.00
Advanced Option Trading with Broken Wing Butterflys with Greg Loehr
1 × $9.00 -
×
 PowerWave Trading with Dar Wong
1 × $4.00
PowerWave Trading with Dar Wong
1 × $4.00 -
×
 Impulse Trading System with Base Camp Trading
1 × $54.00
Impulse Trading System with Base Camp Trading
1 × $54.00 -
×
 Options, Futures & Other Derivatives . Solutions Manual
1 × $6.00
Options, Futures & Other Derivatives . Solutions Manual
1 × $6.00 -
×
 Neowave. Inovations that Make Elliott Wave Work Better for You with Glenn Neely
1 × $6.00
Neowave. Inovations that Make Elliott Wave Work Better for You with Glenn Neely
1 × $6.00 -
×
 Beat the Odds in Forex Trading: How to Identify and Profit from High Percentage Market Patterns with Igor Toshchakov
1 × $6.00
Beat the Odds in Forex Trading: How to Identify and Profit from High Percentage Market Patterns with Igor Toshchakov
1 × $6.00 -
×
 Art & Science of Trend Trading Class with Jeff Bierman
1 × $6.00
Art & Science of Trend Trading Class with Jeff Bierman
1 × $6.00 -
×
 The Orderflows Trade Opportunities Encyclopedia with Michael Valtos
1 × $8.00
The Orderflows Trade Opportunities Encyclopedia with Michael Valtos
1 × $8.00 -
×
 Forex Trading For Beginners with John Jagerson - Investopedia Academy
1 × $6.00
Forex Trading For Beginners with John Jagerson - Investopedia Academy
1 × $6.00 -
×
 Forex Options Trading
1 × $6.00
Forex Options Trading
1 × $6.00 -
×
 Forex Libra Code Software
1 × $31.00
Forex Libra Code Software
1 × $31.00 -
×
 Fund of Funds Investing: A Roadmap to Portfolio Diversification with David Strachman & Richard Bookbinder
1 × $6.00
Fund of Funds Investing: A Roadmap to Portfolio Diversification with David Strachman & Richard Bookbinder
1 × $6.00 -
×
 New Generation Market Profile (May 2014)
1 × $15.00
New Generation Market Profile (May 2014)
1 × $15.00 -
×
 VWAP Trading course with Trade With Trend
1 × $6.00
VWAP Trading course with Trade With Trend
1 × $6.00 -
×
 The Right Stock at the Right Time. Prospering in the Coming Good Years with Larry Williams
1 × $6.00
The Right Stock at the Right Time. Prospering in the Coming Good Years with Larry Williams
1 × $6.00 -
×
 TradeCraft: Your Path to Peak Performance Trading By Adam Grimes
1 × $15.00
TradeCraft: Your Path to Peak Performance Trading By Adam Grimes
1 × $15.00 -
×
 How to Value & Sell your Business with Andrew Heslop
1 × $6.00
How to Value & Sell your Business with Andrew Heslop
1 × $6.00 -
×
 Getting Started With Options with Peter Titus - Marwood Research
1 × $6.00
Getting Started With Options with Peter Titus - Marwood Research
1 × $6.00 -
×
 60 Minute Trader with Chris Kobewka
1 × $6.00
60 Minute Trader with Chris Kobewka
1 × $6.00 -
×
 FX Cartel Online Course
1 × $31.00
FX Cartel Online Course
1 × $31.00 -
×
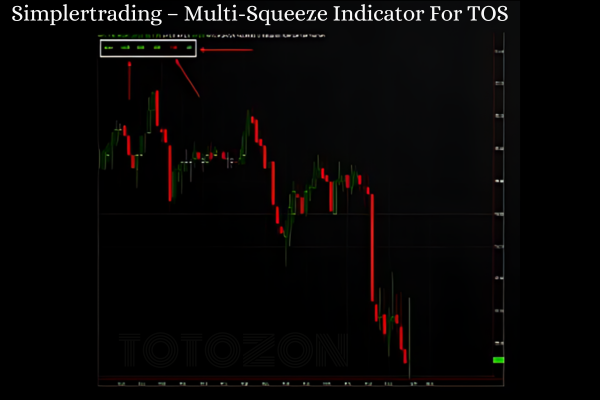 Multi-Squeeze Indicator For TOS
1 × $31.00
Multi-Squeeze Indicator For TOS
1 × $31.00 -
×
 Trading MasterMind Course
1 × $23.00
Trading MasterMind Course
1 × $23.00 -
×
 Market Makers Method Forex Trading with Nick Nechanicky
1 × $5.00
Market Makers Method Forex Trading with Nick Nechanicky
1 × $5.00 -
×
 FX At One Glance - Ichimoku First Glance Video Course
1 × $23.00
FX At One Glance - Ichimoku First Glance Video Course
1 × $23.00 -
×
 Market Masters. How Traders Think Trade And Invest with Jake Bernstein
1 × $6.00
Market Masters. How Traders Think Trade And Invest with Jake Bernstein
1 × $6.00 -
×
 Value, Price & Profit with Karl Marx
1 × $6.00
Value, Price & Profit with Karl Marx
1 × $6.00 -
×
 SE ELITE COURSE with SE TRADINGX
1 × $5.00
SE ELITE COURSE with SE TRADINGX
1 × $5.00 -
×
 Private Seminars
1 × $23.00
Private Seminars
1 × $23.00 -
×
 Virtual Intensive Trader Training
1 × $31.00
Virtual Intensive Trader Training
1 × $31.00 -
×
 Gann’s Scientific Methods Unveiled (Vol I, II)
1 × $6.00
Gann’s Scientific Methods Unveiled (Vol I, II)
1 × $6.00 -
×
 Extreme Events: Robust Portfolio Construction in the Presence of Fat Tails with Malcolm Kemp
1 × $6.00
Extreme Events: Robust Portfolio Construction in the Presence of Fat Tails with Malcolm Kemp
1 × $6.00 -
×
 Forex Trading Plan - Learn How To Set SMART Trading Goals! with Anas Abba & FXMindTrix Academy
1 × $6.00
Forex Trading Plan - Learn How To Set SMART Trading Goals! with Anas Abba & FXMindTrix Academy
1 × $6.00 -
×
 How to Predict and Prepare for a Stock Market Crash with Damon Verial
1 × $6.00
How to Predict and Prepare for a Stock Market Crash with Damon Verial
1 × $6.00 -
×
 Momentum Scalping for Profits with Shay Horowitz
1 × $6.00
Momentum Scalping for Profits with Shay Horowitz
1 × $6.00 -
×
 Predicting Next Weeks’s Range with Charles Drummond
1 × $6.00
Predicting Next Weeks’s Range with Charles Drummond
1 × $6.00 -
×
 DOM Trading Boot Camp with MasterClass Trader
1 × $5.00
DOM Trading Boot Camp with MasterClass Trader
1 × $5.00 -
×
 Forex & Fibonacci Day Trading Seminar - $695
1 × $6.00
Forex & Fibonacci Day Trading Seminar - $695
1 × $6.00 -
×
 Full Members Area (Icludes 2006 Seminar & Webinars) with Tom Yeomans
1 × $6.00
Full Members Area (Icludes 2006 Seminar & Webinars) with Tom Yeomans
1 × $6.00 -
×
 The Box Strategy with Blue Capital Academy
1 × $23.00
The Box Strategy with Blue Capital Academy
1 × $23.00 -
×
 Perfecting Execution and Trade Management Online Masterclass with The Trading Framework
1 × $6.00
Perfecting Execution and Trade Management Online Masterclass with The Trading Framework
1 × $6.00 -
×
 Forex Time Machine with Bill Poulos
1 × $6.00
Forex Time Machine with Bill Poulos
1 × $6.00 -
×
 M3-4u Trading System with John Locke
1 × $5.00
M3-4u Trading System with John Locke
1 × $5.00 -
×
 The Best Option Trading Course with David Jaffee - Best Stock Strategy
1 × $15.00
The Best Option Trading Course with David Jaffee - Best Stock Strategy
1 × $15.00 -
×
 NodeTrader (+ open code) (Nov 2014)
1 × $6.00
NodeTrader (+ open code) (Nov 2014)
1 × $6.00 -
×
 Option Alpha Signals
1 × $15.00
Option Alpha Signals
1 × $15.00 -
×
 0 DTE Options Trading Workshop with Aeromir Corporation
1 × $15.00
0 DTE Options Trading Workshop with Aeromir Corporation
1 × $15.00 -
×
 Learn Before you Loose
1 × $6.00
Learn Before you Loose
1 × $6.00 -
×
 A Traders Astrological Almanac (2001 – 2006) with Jeanne Long
1 × $6.00
A Traders Astrological Almanac (2001 – 2006) with Jeanne Long
1 × $6.00 -
×
 TRADING NFX Course with Andrew NFX
1 × $5.00
TRADING NFX Course with Andrew NFX
1 × $5.00 -
×
 TC Top & Bottom Finder with Trader Confident
1 × $93.00
TC Top & Bottom Finder with Trader Confident
1 × $93.00 -
×
 Gold Trading Academy Video Course
1 × $23.00
Gold Trading Academy Video Course
1 × $23.00 -
×
 Analysis & Interpretation in Qualitative Market Research with Gill Ereaut
1 × $6.00
Analysis & Interpretation in Qualitative Market Research with Gill Ereaut
1 × $6.00 -
×
 LIVE TRADERS - TECHNICAL STOCK TRADING
1 × $23.00
LIVE TRADERS - TECHNICAL STOCK TRADING
1 × $23.00 -
×
 Middle Market M & A: Handbook for Investment Banking and Business Consulting (1st Edition) - Kenneth Marks
1 × $6.00
Middle Market M & A: Handbook for Investment Banking and Business Consulting (1st Edition) - Kenneth Marks
1 × $6.00 -
×
 Futures Broker Home Study Course CTA Series 3 (Fourteenth Ed.) with Center for Futures Education
1 × $6.00
Futures Broker Home Study Course CTA Series 3 (Fourteenth Ed.) with Center for Futures Education
1 × $6.00 -
×
 Indicator Effectiveness Testing & System Creation with David Vomund
1 × $6.00
Indicator Effectiveness Testing & System Creation with David Vomund
1 × $6.00 -
×
 Day Trading Systems & Methods with Charles Le Beau, David Lucas
1 × $6.00
Day Trading Systems & Methods with Charles Le Beau, David Lucas
1 × $6.00 -
×
 WondaFX Signature Strategy with WondaFX
1 × $5.00
WondaFX Signature Strategy with WondaFX
1 × $5.00 -
×
 Scalp Strategy and Flipping Small Accounts with Opes Trading Group
1 × $5.00
Scalp Strategy and Flipping Small Accounts with Opes Trading Group
1 × $5.00 -
×
 Advanced Gap Trading Strategies with Master Trader
1 × $31.00
Advanced Gap Trading Strategies with Master Trader
1 × $31.00 -
×
 Team Candlecharts Trading Strategies with Candle Charts
1 × $31.00
Team Candlecharts Trading Strategies with Candle Charts
1 × $31.00 -
×
 Crystal Ball Pack PLUS bonus Live Trade By Pat Mitchell - Trick Trades
1 × $20.00
Crystal Ball Pack PLUS bonus Live Trade By Pat Mitchell - Trick Trades
1 × $20.00 -
×
 Order flow self-study training program with iMFtracker
1 × $10.00
Order flow self-study training program with iMFtracker
1 × $10.00 -
×
 Measuring Market Risk (2nd Edition) with Kevin Dowd
1 × $6.00
Measuring Market Risk (2nd Edition) with Kevin Dowd
1 × $6.00 -
×
 Bond Market Course with The Macro Compass
1 × $15.00
Bond Market Course with The Macro Compass
1 × $15.00

Reading & Understanding Charts with Andrew Baxter
$6.00
File Size: 311MB
Delivery Time: 1–12 hours
Media Type: Online Course
Content Proof: Watch Here!
You may check content proof of “Reading & Understanding Chartsb with Andrew Baxter” below:

Reading & Understanding Charts with Andrew Baxter
Introduction to Chart Reading
Charts are essential tools for traders, providing visual representations of market data. Andrew Baxter, a renowned trader and educator, shares his expertise on how to read and understand charts effectively. This article will guide you through the basics and advanced techniques of chart reading, helping you make informed trading decisions.
What are Trading Charts?
Definition and Purpose
Trading charts are graphical representations of price movements over time. They help traders analyze trends, identify patterns, and make predictions about future price movements.
Importance of Chart Reading
Understanding charts is crucial for making data-driven decisions in trading. It reduces emotional trading and enhances your ability to spot opportunities and risks.
Types of Trading Charts
1. Line Charts
Line charts are the simplest form of trading charts, showing the closing prices over a period. They provide a clear view of the overall trend but lack detailed information.
2. Bar Charts
Bar charts display the opening, closing, high, and low prices for each period. They offer more information than line charts and help in understanding price volatility.
3. Candlestick Charts
Candlestick charts are popular due to their detailed and visually appealing format. Each candlestick shows the opening, closing, high, and low prices, making it easier to identify market sentiment.
Understanding Candlestick Charts
Components of a Candlestick
- Body: The filled part showing the opening and closing prices.
- Wicks/Shadows: The thin lines representing the high and low prices.
- Color: Indicates whether the closing price was higher (typically green) or lower (typically red) than the opening price.
Common Candlestick Patterns
1. Doji
A Doji occurs when the opening and closing prices are nearly the same, indicating indecision in the market.
2. Hammer
A Hammer has a small body with a long lower wick, suggesting a potential reversal from a downtrend.
3. Engulfing Pattern
An Engulfing pattern occurs when a larger candlestick completely engulfs the previous smaller candlestick, signaling a potential reversal.
Key Chart Patterns
1. Head and Shoulders
This pattern indicates a reversal and is formed by a peak (head) flanked by two smaller peaks (shoulders).
2. Double Top and Double Bottom
These patterns signal a potential reversal. A double top indicates a bearish reversal, while a double bottom suggests a bullish reversal.
3. Triangles
Triangles are continuation patterns that show a period of consolidation before the price continues in the direction of the previous trend.
Using Technical Indicators
1. Moving Averages
Moving averages smooth out price data to identify trends. Common types include Simple Moving Average (SMA) and Exponential Moving Average (EMA).
2. Relative Strength Index (RSI)
RSI measures the speed and change of price movements, indicating overbought or oversold conditions.
3. Moving Average Convergence Divergence (MACD)
MACD shows the relationship between two moving averages, helping to identify potential buy and sell signals.
Combining Chart Patterns and Indicators
Integrated Analysis
Combining chart patterns with technical indicators enhances the reliability of trading signals. For example, confirming a head and shoulders pattern with RSI divergence can provide a stronger signal.
Practical Application
Use a combination of patterns and indicators to develop a comprehensive trading strategy. This approach helps in making more informed and confident trading decisions.
Advanced Chart Reading Techniques
1. Fibonacci Retracement
Fibonacci retracement levels indicate potential support and resistance levels based on the Fibonacci sequence.
2. Volume Analysis
Volume analysis involves examining the number of shares traded to confirm the strength of a price movement or trend.
3. Divergence
Divergence occurs when the price moves in the opposite direction of an indicator, signaling a potential reversal.
Common Mistakes in Chart Reading
1. Overcomplicating Analysis
Avoid using too many indicators and patterns at once. Focus on a few reliable tools to keep your analysis clear and effective.
2. Ignoring Context
Always consider the broader market context and economic factors. Relying solely on charts without context can lead to misleading conclusions.
3. Emotional Trading
Stick to your analysis and avoid making decisions based on emotions. Emotional trading can undermine even the best chart reading skills.
Benefits of Mastering Chart Reading
1. Improved Decision Making
Accurate chart reading helps you make informed decisions, reducing the risk of losses and increasing the potential for gains.
2. Enhanced Trading Strategy
Understanding charts allows you to develop and refine your trading strategies, making them more effective and adaptable.
3. Increased Confidence
With better chart reading skills, you gain confidence in your trading decisions, leading to more consistent performance.
Conclusion
Reading and understanding charts with insights from Andrew Baxter can significantly improve your trading performance. By mastering various chart types, patterns, and technical indicators, you can make more informed decisions and develop robust trading strategies. Embrace these principles, continuously practice, and refine your skills to become a proficient trader.
Frequently Asked Questions:
What are the main types of trading charts?
The main types are line charts, bar charts, and candlestick charts.
Why are candlestick charts popular?
Candlestick charts are popular due to their detailed and visually appealing format, making it easier to identify market sentiment.
What are some common candlestick patterns?
Common patterns include Doji, Hammer, and Engulfing patterns.
How can technical indicators enhance chart reading?
Technical indicators like moving averages, RSI, and MACD help identify trends, momentum, and potential buy/sell signals.
What are some advanced chart reading techniques?
Advanced techniques include Fibonacci retracement, volume analysis, and divergence.
Be the first to review “Reading & Understanding Charts with Andrew Baxter”
You must be logged in to post a review.
Related products
Forex Trading
Original price was: $125.00.$17.00Current price is: $17.00.

Forex Trading
Original price was: $2,995.00.$31.00Current price is: $31.00.

Original price was: $997.00.$8.00Current price is: $8.00.
Forex Trading
Original price was: $239.00.$8.00Current price is: $8.00.

Forex Trading
Quantamentals – The Next Great Forefront Of Trading and Investing with Trading Markets
Original price was: $1,495.00.$8.00Current price is: $8.00.

Forex Trading
The Complete Guide to Multiple Time Frame Analysis & Reading Price Action with Aiman Almansoori
Original price was: $1,399.00.$13.00Current price is: $13.00.

Original price was: $1,800.00.$54.00Current price is: $54.00.
Forex Trading
Original price was: $1,898.00.$10.00Current price is: $10.00.

Forex Trading
Original price was: $850.00.$23.00Current price is: $23.00.

Original price was: $2,120.00.$15.00Current price is: $15.00.
Original price was: $450.00.$23.00Current price is: $23.00.

Forex Trading
Original price was: $1,098.00.$39.00Current price is: $39.00.

Forex Trading
Original price was: $799.00.$15.00Current price is: $15.00.
Original price was: $299.00.$8.00Current price is: $8.00.
Original price was: $1,849.00.$15.00Current price is: $15.00.
Forex Trading
Original price was: $500.00.$5.00Current price is: $5.00.
Forex Trading
Original price was: $499.00.$15.00Current price is: $15.00.

Forex Trading
Original price was: $397.00.$31.00Current price is: $31.00.

Original price was: $310.00.$23.00Current price is: $23.00.

Original price was: $895.00.$15.00Current price is: $15.00.

Reviews
There are no reviews yet.