-
×
 Trading Indicators for the 21st Century
1 × $6.00
Trading Indicators for the 21st Century
1 × $6.00 -
×
 Ocean’s CPA Force (Ebook)
1 × $6.00
Ocean’s CPA Force (Ebook)
1 × $6.00 -
×
 Scalping Strategy Webinar! recorded. BEST WEBINAR
1 × $23.00
Scalping Strategy Webinar! recorded. BEST WEBINAR
1 × $23.00 -
×
 The Orderflow Masterclass with PrimeTrading
1 × $17.00
The Orderflow Masterclass with PrimeTrading
1 × $17.00 -
×
 Pristine - Tom Willard – Creating The Ultimate Trading Psychology Using 3 Key Concepts
1 × $6.00
Pristine - Tom Willard – Creating The Ultimate Trading Psychology Using 3 Key Concepts
1 × $6.00 -
×
 Advanced Option Trading with Broken Wing Butterflys with Greg Loehr
1 × $9.00
Advanced Option Trading with Broken Wing Butterflys with Greg Loehr
1 × $9.00 -
×
 WYCKOFF TRADING COURSE (WTC) PART I – ANALYSIS (Fall 2021) with Roman Bogomazov
1 × $209.00
WYCKOFF TRADING COURSE (WTC) PART I – ANALYSIS (Fall 2021) with Roman Bogomazov
1 × $209.00 -
×
 How to Get Rich Buying Stocks with Ira U.Cobleigh
1 × $6.00
How to Get Rich Buying Stocks with Ira U.Cobleigh
1 × $6.00 -
×
 Practical Elliott Wave Trading Strategies with Robert Miner
1 × $6.00
Practical Elliott Wave Trading Strategies with Robert Miner
1 × $6.00 -
×
 7 DAY INTENSIVE ONLINE TRADER TRAINING PROGRAMME with The Trading Framework
1 × $15.00
7 DAY INTENSIVE ONLINE TRADER TRAINING PROGRAMME with The Trading Framework
1 × $15.00 -
×
 Emini Volume Break Out System
1 × $6.00
Emini Volume Break Out System
1 × $6.00 -
×
 Forecast 2024 Clarification with Larry Williams
1 × $15.00
Forecast 2024 Clarification with Larry Williams
1 × $15.00 -
×
 Video Package
1 × $6.00
Video Package
1 × $6.00 -
×
 Pro Trading Blueprint with Limitless Forex Academy
1 × $5.00
Pro Trading Blueprint with Limitless Forex Academy
1 × $5.00 -
×
 Futures Masterclass with Market Flow Trader
1 × $17.00
Futures Masterclass with Market Flow Trader
1 × $17.00 -
×
 Price Action Trading Volume 1 with Fractal Flow Pro
1 × $6.00
Price Action Trading Volume 1 with Fractal Flow Pro
1 × $6.00 -
×
 AutoTrader-Fully Automated Trading System with Trading123
1 × $46.00
AutoTrader-Fully Automated Trading System with Trading123
1 × $46.00 -
×
 Shawn Sharma Mentorship Program
1 × $34.00
Shawn Sharma Mentorship Program
1 × $34.00 -
×
 The Complete Guide to Option Selling with James Cordier
1 × $6.00
The Complete Guide to Option Selling with James Cordier
1 × $6.00 -
×
 The Insured Portfolio: Your Gateway to Stress-Free Global Investments with Erika Nolan, Marc-Andre Sola & Shannon Crouch
1 × $6.00
The Insured Portfolio: Your Gateway to Stress-Free Global Investments with Erika Nolan, Marc-Andre Sola & Shannon Crouch
1 × $6.00 -
×
 The Traders Battle Plan
1 × $6.00
The Traders Battle Plan
1 × $6.00 -
×
 Forex Profit Multiplier with Bill & Greg Poulos
1 × $6.00
Forex Profit Multiplier with Bill & Greg Poulos
1 × $6.00 -
×
 Swing Trading Systems Video Home Study, Presented with Ken Long - Van Tharp Institute
1 × $5.00
Swing Trading Systems Video Home Study, Presented with Ken Long - Van Tharp Institute
1 × $5.00 -
×
 Professional Approaches to Directional Option Trading with Option Pit
1 × $23.00
Professional Approaches to Directional Option Trading with Option Pit
1 × $23.00 -
×
 iMarketsLive Academy Course
1 × $5.00
iMarketsLive Academy Course
1 × $5.00 -
×
 Elliott Wave Forex Course
1 × $6.00
Elliott Wave Forex Course
1 × $6.00 -
×
 Investment Mathematics with Andrew Adams
1 × $6.00
Investment Mathematics with Andrew Adams
1 × $6.00 -
×
 High Rollers Mega Course Bundle - 13 Market Moves
1 × $39.00
High Rollers Mega Course Bundle - 13 Market Moves
1 × $39.00 -
×
 How Big Money Trades A Key Aspect of Systems Thinking - Van Tharp and Chuck Whitman – Van Tharp
1 × $46.00
How Big Money Trades A Key Aspect of Systems Thinking - Van Tharp and Chuck Whitman – Van Tharp
1 × $46.00 -
×
 Trading with Wave59 with Earik Beann
1 × $6.00
Trading with Wave59 with Earik Beann
1 × $6.00 -
×
 TheVWAP with Zach Hurwitz
1 × $5.00
TheVWAP with Zach Hurwitz
1 × $5.00 -
×
 Master Forecasting Method & Unpublished Stock Market Forecasting Courses with W.D.Gann
1 × $6.00
Master Forecasting Method & Unpublished Stock Market Forecasting Courses with W.D.Gann
1 × $6.00 -
×
 Four Dimensional Stock Market Structures & Cycles with Bradley Cowan
1 × $6.00
Four Dimensional Stock Market Structures & Cycles with Bradley Cowan
1 × $6.00 -
×
 Change Happens. Do You Profit Or Does Someone Else (Traders Expo Las Vegas Dec 2005) by Tobin Smith
1 × $6.00
Change Happens. Do You Profit Or Does Someone Else (Traders Expo Las Vegas Dec 2005) by Tobin Smith
1 × $6.00 -
×
 Elite Mentorship Home Study - 3T Live with Sami Abusaad
1 × $5.00
Elite Mentorship Home Study - 3T Live with Sami Abusaad
1 × $5.00 -
×
 Ultimate and Options Trading MasterClass Bundle with FX Evolution
1 × $54.00
Ultimate and Options Trading MasterClass Bundle with FX Evolution
1 × $54.00 -
×
 Options For Gold, Oil and Other Commodities
1 × $6.00
Options For Gold, Oil and Other Commodities
1 × $6.00 -
×
 Forex Trading For Beginners with John Jagerson - Investopedia Academy
1 × $6.00
Forex Trading For Beginners with John Jagerson - Investopedia Academy
1 × $6.00 -
×
 White Phoenix’s The Smart (Money) Approach to Trading with Jayson Casper
1 × $39.00
White Phoenix’s The Smart (Money) Approach to Trading with Jayson Casper
1 × $39.00 -
×
 Scanning For Gold with Doug Sutton
1 × $6.00
Scanning For Gold with Doug Sutton
1 × $6.00 -
×
 Filtered Waves. Basic Theory with Arthur A.Merrill
1 × $7.00
Filtered Waves. Basic Theory with Arthur A.Merrill
1 × $7.00 -
×
 Practical Astro with Ruth Miller & Iam Williams
1 × $6.00
Practical Astro with Ruth Miller & Iam Williams
1 × $6.00 -
×
 Short-Term Traders’ Secrets. Candlesticks, Gaps & Breakout Patterns Revealed with Steve Nison & Ken Calhoun
1 × $6.00
Short-Term Traders’ Secrets. Candlesticks, Gaps & Breakout Patterns Revealed with Steve Nison & Ken Calhoun
1 × $6.00 -
×
 Rapid Results Method with Russ Horn
1 × $6.00
Rapid Results Method with Russ Horn
1 × $6.00 -
×
 Oportunities in Forex Calendar Trading Patterns with Anduril Analytics
1 × $6.00
Oportunities in Forex Calendar Trading Patterns with Anduril Analytics
1 × $6.00 -
×
 Options 201: Vertical and Calendar Spread Essentials 5 Part Class with Don Kaufman On Demand Replay
1 × $6.00
Options 201: Vertical and Calendar Spread Essentials 5 Part Class with Don Kaufman On Demand Replay
1 × $6.00 -
×
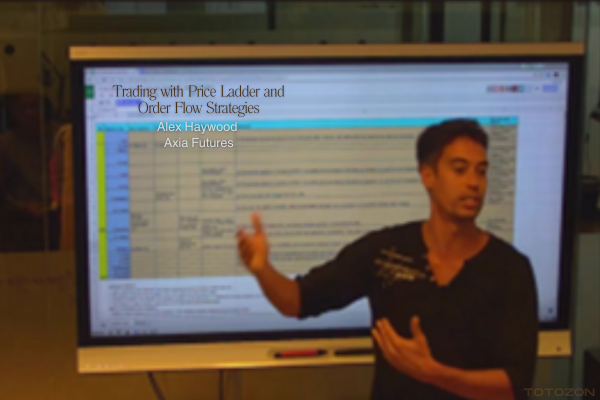 Trading with Price Ladder and Order Flow Strategies with Alex Haywood - Axia Futures
1 × $6.00
Trading with Price Ladder and Order Flow Strategies with Alex Haywood - Axia Futures
1 × $6.00 -
×
 Crystal Ball Pack PLUS bonus Live Trade By Pat Mitchell - Trick Trades
1 × $20.00
Crystal Ball Pack PLUS bonus Live Trade By Pat Mitchell - Trick Trades
1 × $20.00 -
×
 BOSSPack Course with Pat Mitchell – Trick Trades
1 × $69.00
BOSSPack Course with Pat Mitchell – Trick Trades
1 × $69.00 -
×
 Best of the Best: Collars with Amy Meissner & Scott Ruble
1 × $15.00
Best of the Best: Collars with Amy Meissner & Scott Ruble
1 × $15.00 -
×
 Professor Jeff Bierman's 15 Class Bundle (The Professor's Package)
1 × $6.00
Professor Jeff Bierman's 15 Class Bundle (The Professor's Package)
1 × $6.00 -
×
 Timing the Market with Unique Indicators with Sherman McCellan
1 × $6.00
Timing the Market with Unique Indicators with Sherman McCellan
1 × $6.00 -
×
 Scalp Strategy and Flipping Small Accounts with Opes Trading Group
1 × $5.00
Scalp Strategy and Flipping Small Accounts with Opes Trading Group
1 × $5.00 -
×
 Candlesticks Re-Ignited Workshop
1 × $23.00
Candlesticks Re-Ignited Workshop
1 × $23.00 -
×
 Seasonal Stock Market Trends: The Definitive Guide to Calendar‐Based Stock Market Trading with Jay Kaeppel
1 × $6.00
Seasonal Stock Market Trends: The Definitive Guide to Calendar‐Based Stock Market Trading with Jay Kaeppel
1 × $6.00 -
×
 Core Strategy Program with Ota Courses
1 × $174.00
Core Strategy Program with Ota Courses
1 × $174.00 -
×
 Matrix Spread Options Trading Course with Base Camp Trading
1 × $31.00
Matrix Spread Options Trading Course with Base Camp Trading
1 × $31.00 -
×
 Hubert Senters’ Squeeze Play Strategy & Tradestation Code with Hubert Senters
1 × $6.00
Hubert Senters’ Squeeze Play Strategy & Tradestation Code with Hubert Senters
1 × $6.00 -
×
 Professional Trader Course
1 × $5.00
Professional Trader Course
1 × $5.00 -
×
 Profitable DayTrading with Precision - George Angell
1 × $6.00
Profitable DayTrading with Precision - George Angell
1 × $6.00 -
×
 Self-Mastery Course with Steven Cruz
1 × $62.00
Self-Mastery Course with Steven Cruz
1 × $62.00 -
×
 FX GOAT 3.0 (ALL IN ONE) with FX GOAT FOREX TRADING ACADEMY
1 × $5.00
FX GOAT 3.0 (ALL IN ONE) with FX GOAT FOREX TRADING ACADEMY
1 × $5.00 -
×
 Coulda, woulda, shoulda with Charles Cottle
1 × $6.00
Coulda, woulda, shoulda with Charles Cottle
1 × $6.00 -
×
 Options Trading for the Conservative Trader with Michael Thomsett
1 × $6.00
Options Trading for the Conservative Trader with Michael Thomsett
1 × $6.00 -
×
 Trading Trainer - 6 Percent Protocol
1 × $39.00
Trading Trainer - 6 Percent Protocol
1 × $39.00 -
×
 Yarimi University Course
1 × $56.00
Yarimi University Course
1 × $56.00 -
×
 MATS Market Auction Trading System with Ryan Watts
1 × $6.00
MATS Market Auction Trading System with Ryan Watts
1 × $6.00 -
×
 Stock Selection Course with Dave Landry
1 × $6.00
Stock Selection Course with Dave Landry
1 × $6.00 -
×
 Freak Forex Fundamentals with Ken FX Freak
1 × $6.00
Freak Forex Fundamentals with Ken FX Freak
1 × $6.00 -
×
 Random Walk Trading - J.L.Lord - One Strategy for All Markets
1 × $6.00
Random Walk Trading - J.L.Lord - One Strategy for All Markets
1 × $6.00 -
×
 The Stock Market Trading Secrets of the Late (1940, scaned)
1 × $6.00
The Stock Market Trading Secrets of the Late (1940, scaned)
1 × $6.00 -
×
 The Orderflows Trade Opportunities Encyclopedia with Michael Valtos
1 × $8.00
The Orderflows Trade Opportunities Encyclopedia with Michael Valtos
1 × $8.00 -
×
 Day Trading and Swing Trading Strategies For Stocks By Mohsen Hassan
1 × $6.00
Day Trading and Swing Trading Strategies For Stocks By Mohsen Hassan
1 × $6.00 -
×
 Options University - Ron Ianieri – Options University Live Seminars
1 × $6.00
Options University - Ron Ianieri – Options University Live Seminars
1 × $6.00 -
×
 Trading Mindset, and Three Steps To Profitable Trading with Bruce Banks
1 × $6.00
Trading Mindset, and Three Steps To Profitable Trading with Bruce Banks
1 × $6.00 -
×
 Base Camp Trading – Bundle 5 Courses
1 × $5.00
Base Camp Trading – Bundle 5 Courses
1 × $5.00 -
×
 eASCTrend Trading Manual (not including 6 trading methods) with Ablesys
1 × $6.00
eASCTrend Trading Manual (not including 6 trading methods) with Ablesys
1 × $6.00 -
×
 Swing Trader Pro with Top Trade Tools
1 × $54.00
Swing Trader Pro with Top Trade Tools
1 × $54.00 -
×
 Learn to Trade Course with Mike Aston
1 × $6.00
Learn to Trade Course with Mike Aston
1 × $6.00 -
×
 Forex Day Trading Course with Raul Gonzalez
1 × $5.00
Forex Day Trading Course with Raul Gonzalez
1 × $5.00 -
×
 Gamma Options Boot Camp with Bigtrends
1 × $74.00
Gamma Options Boot Camp with Bigtrends
1 × $74.00 -
×
 Tradeguider - Wyckoff VSA eBook Collection
1 × $23.00
Tradeguider - Wyckoff VSA eBook Collection
1 × $23.00 -
×
 Pattern- Price & Time. Using Gann Theory in Trading Systems (2nd Ed.)
1 × $6.00
Pattern- Price & Time. Using Gann Theory in Trading Systems (2nd Ed.)
1 × $6.00 -
×
 Candlestick and Pivot Point Trading Triggers with John Person
1 × $6.00
Candlestick and Pivot Point Trading Triggers with John Person
1 × $6.00 -
×
 The Noise Trader Approach to Finance (Article) with Andrei Schleifer, Laurence H.Summers
1 × $6.00
The Noise Trader Approach to Finance (Article) with Andrei Schleifer, Laurence H.Summers
1 × $6.00 -
×
 Evolution Markets Forex Course - Evolution Markets
1 × $5.00
Evolution Markets Forex Course - Evolution Markets
1 × $5.00 -
×
 Pete Fader VSA Course
1 × $6.00
Pete Fader VSA Course
1 × $6.00 -
×
 Trade Execution with Yuri Shramenko
1 × $6.00
Trade Execution with Yuri Shramenko
1 × $6.00 -
×
 Practical Approach to Amibroker Backtesting with Rajandran R
1 × $6.00
Practical Approach to Amibroker Backtesting with Rajandran R
1 × $6.00 -
×
 Sacredscience - Paul Councel – X Marks My Place
1 × $6.00
Sacredscience - Paul Councel – X Marks My Place
1 × $6.00 -
×
 Order flow self-study training program with iMFtracker
1 × $10.00
Order flow self-study training program with iMFtracker
1 × $10.00 -
×
 Apteros Trading Fall Intensive 2021 - Trading Intensive
1 × $54.00
Apteros Trading Fall Intensive 2021 - Trading Intensive
1 × $54.00 -
×
 Butterfly and Condor Workshop with Aeromir
1 × $15.00
Butterfly and Condor Workshop with Aeromir
1 × $15.00

Reading & Understanding Charts with Andrew Baxter
$6.00
File Size: 311MB
Delivery Time: 1–12 hours
Media Type: Online Course
Content Proof: Watch Here!
You may check content proof of “Reading & Understanding Chartsb with Andrew Baxter” below:

Reading & Understanding Charts with Andrew Baxter
Introduction to Chart Reading
Charts are essential tools for traders, providing visual representations of market data. Andrew Baxter, a renowned trader and educator, shares his expertise on how to read and understand charts effectively. This article will guide you through the basics and advanced techniques of chart reading, helping you make informed trading decisions.
What are Trading Charts?
Definition and Purpose
Trading charts are graphical representations of price movements over time. They help traders analyze trends, identify patterns, and make predictions about future price movements.
Importance of Chart Reading
Understanding charts is crucial for making data-driven decisions in trading. It reduces emotional trading and enhances your ability to spot opportunities and risks.
Types of Trading Charts
1. Line Charts
Line charts are the simplest form of trading charts, showing the closing prices over a period. They provide a clear view of the overall trend but lack detailed information.
2. Bar Charts
Bar charts display the opening, closing, high, and low prices for each period. They offer more information than line charts and help in understanding price volatility.
3. Candlestick Charts
Candlestick charts are popular due to their detailed and visually appealing format. Each candlestick shows the opening, closing, high, and low prices, making it easier to identify market sentiment.
Understanding Candlestick Charts
Components of a Candlestick
- Body: The filled part showing the opening and closing prices.
- Wicks/Shadows: The thin lines representing the high and low prices.
- Color: Indicates whether the closing price was higher (typically green) or lower (typically red) than the opening price.
Common Candlestick Patterns
1. Doji
A Doji occurs when the opening and closing prices are nearly the same, indicating indecision in the market.
2. Hammer
A Hammer has a small body with a long lower wick, suggesting a potential reversal from a downtrend.
3. Engulfing Pattern
An Engulfing pattern occurs when a larger candlestick completely engulfs the previous smaller candlestick, signaling a potential reversal.
Key Chart Patterns
1. Head and Shoulders
This pattern indicates a reversal and is formed by a peak (head) flanked by two smaller peaks (shoulders).
2. Double Top and Double Bottom
These patterns signal a potential reversal. A double top indicates a bearish reversal, while a double bottom suggests a bullish reversal.
3. Triangles
Triangles are continuation patterns that show a period of consolidation before the price continues in the direction of the previous trend.
Using Technical Indicators
1. Moving Averages
Moving averages smooth out price data to identify trends. Common types include Simple Moving Average (SMA) and Exponential Moving Average (EMA).
2. Relative Strength Index (RSI)
RSI measures the speed and change of price movements, indicating overbought or oversold conditions.
3. Moving Average Convergence Divergence (MACD)
MACD shows the relationship between two moving averages, helping to identify potential buy and sell signals.
Combining Chart Patterns and Indicators
Integrated Analysis
Combining chart patterns with technical indicators enhances the reliability of trading signals. For example, confirming a head and shoulders pattern with RSI divergence can provide a stronger signal.
Practical Application
Use a combination of patterns and indicators to develop a comprehensive trading strategy. This approach helps in making more informed and confident trading decisions.
Advanced Chart Reading Techniques
1. Fibonacci Retracement
Fibonacci retracement levels indicate potential support and resistance levels based on the Fibonacci sequence.
2. Volume Analysis
Volume analysis involves examining the number of shares traded to confirm the strength of a price movement or trend.
3. Divergence
Divergence occurs when the price moves in the opposite direction of an indicator, signaling a potential reversal.
Common Mistakes in Chart Reading
1. Overcomplicating Analysis
Avoid using too many indicators and patterns at once. Focus on a few reliable tools to keep your analysis clear and effective.
2. Ignoring Context
Always consider the broader market context and economic factors. Relying solely on charts without context can lead to misleading conclusions.
3. Emotional Trading
Stick to your analysis and avoid making decisions based on emotions. Emotional trading can undermine even the best chart reading skills.
Benefits of Mastering Chart Reading
1. Improved Decision Making
Accurate chart reading helps you make informed decisions, reducing the risk of losses and increasing the potential for gains.
2. Enhanced Trading Strategy
Understanding charts allows you to develop and refine your trading strategies, making them more effective and adaptable.
3. Increased Confidence
With better chart reading skills, you gain confidence in your trading decisions, leading to more consistent performance.
Conclusion
Reading and understanding charts with insights from Andrew Baxter can significantly improve your trading performance. By mastering various chart types, patterns, and technical indicators, you can make more informed decisions and develop robust trading strategies. Embrace these principles, continuously practice, and refine your skills to become a proficient trader.
Frequently Asked Questions:
What are the main types of trading charts?
The main types are line charts, bar charts, and candlestick charts.
Why are candlestick charts popular?
Candlestick charts are popular due to their detailed and visually appealing format, making it easier to identify market sentiment.
What are some common candlestick patterns?
Common patterns include Doji, Hammer, and Engulfing patterns.
How can technical indicators enhance chart reading?
Technical indicators like moving averages, RSI, and MACD help identify trends, momentum, and potential buy/sell signals.
What are some advanced chart reading techniques?
Advanced techniques include Fibonacci retracement, volume analysis, and divergence.
Be the first to review “Reading & Understanding Charts with Andrew Baxter”
You must be logged in to post a review.
Related products

Forex Trading
Original price was: $1,098.00.$39.00Current price is: $39.00.

Original price was: $310.00.$23.00Current price is: $23.00.

Original price was: $1,800.00.$54.00Current price is: $54.00.
Forex Trading
Original price was: $1,898.00.$10.00Current price is: $10.00.
Original price was: $700.00.$39.00Current price is: $39.00.

Original price was: $895.00.$15.00Current price is: $15.00.

Forex Trading
Original price was: $2,000.00.$23.00Current price is: $23.00.

Original price was: $497.00.$11.00Current price is: $11.00.

Original price was: $695.00.$41.00Current price is: $41.00.

Original price was: $197.00.$5.00Current price is: $5.00.
Forex Trading
Original price was: $125.00.$17.00Current price is: $17.00.
Original price was: $299.00.$8.00Current price is: $8.00.

Forex Trading
Original price was: $499.00.$15.00Current price is: $15.00.

Original price was: $997.00.$8.00Current price is: $8.00.

Original price was: $2,120.00.$15.00Current price is: $15.00.

Original price was: $4,995.00.$15.00Current price is: $15.00.

Forex Trading
Original price was: $2,997.00.$23.00Current price is: $23.00.

Original price was: $139.00.$23.00Current price is: $23.00.

Original price was: $997.00.$13.00Current price is: $13.00.
Original price was: $497.00.$31.00Current price is: $31.00.

Reviews
There are no reviews yet.