-
×
 Crystal Ball Pack PLUS bonus Live Trade By Pat Mitchell - Trick Trades
1 × $20.00
Crystal Ball Pack PLUS bonus Live Trade By Pat Mitchell - Trick Trades
1 × $20.00 -
×
 A Comparison of Popular Trading Systems (2nd Ed.) with Lars Kestner
1 × $6.00
A Comparison of Popular Trading Systems (2nd Ed.) with Lars Kestner
1 × $6.00 -
×
 RSI Unleashed: Building a Comprehensive Trading Framework By Doc Severson
1 × $6.00
RSI Unleashed: Building a Comprehensive Trading Framework By Doc Severson
1 × $6.00 -
×
 ProfileTraders - Swing and Price Analysis (May 2014)
1 × $6.00
ProfileTraders - Swing and Price Analysis (May 2014)
1 × $6.00 -
×
 The Handbook of Alternative Investments with Darrell R.Jobman
1 × $6.00
The Handbook of Alternative Investments with Darrell R.Jobman
1 × $6.00 -
×
 CFA Level 3- Examination Morning Session – Essay (2004)
1 × $6.00
CFA Level 3- Examination Morning Session – Essay (2004)
1 × $6.00 -
×
 Active Beta Indexes with Khalid Ghayur
1 × $6.00
Active Beta Indexes with Khalid Ghayur
1 × $6.00 -
×
 How Do You See Risk? A Guide to Evaluating & Applying Technical Volatility Indicators class with Jeff Bierman
1 × $6.00
How Do You See Risk? A Guide to Evaluating & Applying Technical Volatility Indicators class with Jeff Bierman
1 × $6.00 -
×
 A-Z Course with InvestiTrade Academy
1 × $5.00
A-Z Course with InvestiTrade Academy
1 × $5.00 -
×
 Profit Before Work System with John Piper
1 × $6.00
Profit Before Work System with John Piper
1 × $6.00 -
×
 The Practical Fractal with Bill Williams
1 × $6.00
The Practical Fractal with Bill Williams
1 × $6.00 -
×
 Forecast 2024 Clarification with Larry Williams
1 × $15.00
Forecast 2024 Clarification with Larry Williams
1 × $15.00 -
×
 Trading Short TermSame Day Trades Sep 2023 with Dan Sheridan & Mark Fenton - Sheridan Options Mentoring
1 × $31.00
Trading Short TermSame Day Trades Sep 2023 with Dan Sheridan & Mark Fenton - Sheridan Options Mentoring
1 × $31.00 -
×
 Crypto Trading Academy with Cheeky Investor - Aussie Day Trader
1 × $13.00
Crypto Trading Academy with Cheeky Investor - Aussie Day Trader
1 × $13.00 -
×
 The Adventures of the Cycle Hunter. The Trader with Craig Bttlc
1 × $6.00
The Adventures of the Cycle Hunter. The Trader with Craig Bttlc
1 × $6.00 -
×
 Volatility Trading with Fractal Flow Pro
1 × $15.00
Volatility Trading with Fractal Flow Pro
1 × $15.00 -
×
 Short-Term Trading with Precision Timing - Jack Bernstein
1 × $6.00
Short-Term Trading with Precision Timing - Jack Bernstein
1 × $6.00 -
×
 White Phoenix’s The Smart (Money) Approach to Trading with Jayson Casper
1 × $39.00
White Phoenix’s The Smart (Money) Approach to Trading with Jayson Casper
1 × $39.00 -
×
 The Orderflow Masterclass with PrimeTrading
1 × $17.00
The Orderflow Masterclass with PrimeTrading
1 × $17.00 -
×
 The Complete Turtle Trader with Michael Covel
1 × $6.00
The Complete Turtle Trader with Michael Covel
1 × $6.00 -
×
 Systems Mastery Course with Chris Dover - Pollinate Trading
1 × $5.00
Systems Mastery Course with Chris Dover - Pollinate Trading
1 × $5.00 -
×
 30 Day Masterclass with Joe Elite Trader Hub ICT
1 × $6.00
30 Day Masterclass with Joe Elite Trader Hub ICT
1 × $6.00 -
×
 The 80% Solution S&P Systems with Bruce Babcock
1 × $6.00
The 80% Solution S&P Systems with Bruce Babcock
1 × $6.00 -
×
 Trading with Wave59 with Earik Beann
1 × $6.00
Trading with Wave59 with Earik Beann
1 × $6.00 -
×
 Futures 101: An Introduction to Futures Contracts Class with Don Kaufman
1 × $6.00
Futures 101: An Introduction to Futures Contracts Class with Don Kaufman
1 × $6.00 -
×
 Stock Market Investing for Financial Independence & Retiring Early with Amon & Christina
1 × $15.00
Stock Market Investing for Financial Independence & Retiring Early with Amon & Christina
1 × $15.00 -
×
 Traders Winning Edge with Adrienne Laris Toghraie
1 × $6.00
Traders Winning Edge with Adrienne Laris Toghraie
1 × $6.00 -
×
 Mastertrader – Mastering Swing Trading
1 × $31.00
Mastertrader – Mastering Swing Trading
1 × $31.00 -
×
 CAT 2007 Seminar with Stephen W.Bigalow
1 × $6.00
CAT 2007 Seminar with Stephen W.Bigalow
1 × $6.00 -
×
 Profits In PJs - Profitably Selling Stock Options for Passive Income with Cam Tucker
1 × $6.00
Profits In PJs - Profitably Selling Stock Options for Passive Income with Cam Tucker
1 × $6.00 -
×
 Path to Profits By Scott Redler - T3 Live
1 × $6.00
Path to Profits By Scott Redler - T3 Live
1 × $6.00 -
×
![ACD Method [Video (6 MP4s)] with Mark Fisher](https://www.totozon.com/wp-content/uploads/2024/05/ACD-Method-Video-6-MP4s-with-Mark-Fisher.jpg) ACD Method [Video (6 MP4s)] with Mark Fisher
1 × $6.00
ACD Method [Video (6 MP4s)] with Mark Fisher
1 × $6.00 -
×
 The Correlation Code with Jason Fielder
1 × $6.00
The Correlation Code with Jason Fielder
1 × $6.00 -
×
 How to Buy Stocks Before They Skyrocket
1 × $6.00
How to Buy Stocks Before They Skyrocket
1 × $6.00 -
×
 Volume Profile 2023 (Elite Pack) with Trader Dale
1 × $5.00
Volume Profile 2023 (Elite Pack) with Trader Dale
1 × $5.00 -
×
 Evolve MasterClass with Irek Piekarski
1 × $13.00
Evolve MasterClass with Irek Piekarski
1 × $13.00 -
×
 Gann Trade Real Time with Larry B.Jacobs
1 × $6.00
Gann Trade Real Time with Larry B.Jacobs
1 × $6.00 -
×
 The A14 Weekly Option Strategy Workshop with Amy Meissner
1 × $23.00
The A14 Weekly Option Strategy Workshop with Amy Meissner
1 × $23.00 -
×
 An Empirical Ananlysis of Stock Market Sentiment (Article) with Andrea Terzi
1 × $6.00
An Empirical Ananlysis of Stock Market Sentiment (Article) with Andrea Terzi
1 × $6.00 -
×
 How to Build Fortune. Trading Stock Index Futures with Dennis Minogue
1 × $6.00
How to Build Fortune. Trading Stock Index Futures with Dennis Minogue
1 × $6.00 -
×
 A Mathematician Plays The Stock Market with John Allen Paulos
1 × $6.00
A Mathematician Plays The Stock Market with John Allen Paulos
1 × $6.00 -
×
 CarterFX Membership with Duran Carter
1 × $23.00
CarterFX Membership with Duran Carter
1 × $23.00 -
×
 Basic Day Trading Techniques with Michael Jenkins
1 × $6.00
Basic Day Trading Techniques with Michael Jenkins
1 × $6.00 -
×
 Contrarian Investment Strategies: The Next Generation with David Dreman
1 × $4.00
Contrarian Investment Strategies: The Next Generation with David Dreman
1 × $4.00 -
×
 Harnessing Explosive Market Turns - 3 DVD with Jeff Greenblatt
1 × $6.00
Harnessing Explosive Market Turns - 3 DVD with Jeff Greenblatt
1 × $6.00 -
×
 Fibonacci for the Active Trader with Derrik Hobbs
1 × $6.00
Fibonacci for the Active Trader with Derrik Hobbs
1 × $6.00 -
×
 WondaFX Signature Strategy with WondaFX
1 × $5.00
WondaFX Signature Strategy with WondaFX
1 × $5.00 -
×
 Signals
1 × $6.00
Signals
1 × $6.00 -
×
 The Adventures of the Cycle Hunter. The Cyclist with Craig Bttlc
1 × $6.00
The Adventures of the Cycle Hunter. The Cyclist with Craig Bttlc
1 × $6.00 -
×
 Euro Trading Course with Bkforex
1 × $6.00
Euro Trading Course with Bkforex
1 × $6.00 -
×
 The Complete Value Investing Course (Updated 2019) with Wealthy Education
1 × $6.00
The Complete Value Investing Course (Updated 2019) with Wealthy Education
1 × $6.00 -
×
 Advanced GET 8.0 EOD
1 × $6.00
Advanced GET 8.0 EOD
1 × $6.00 -
×
 Trading Freak Academy (Full Course) with JP - Trading Freak
1 × $5.00
Trading Freak Academy (Full Course) with JP - Trading Freak
1 × $5.00 -
×
 Algo Trading Masterclass with Ali Casey - StatOasis
1 × $23.00
Algo Trading Masterclass with Ali Casey - StatOasis
1 × $23.00 -
×
 Advanced Pattern Recognition with John Cameron
1 × $23.00
Advanced Pattern Recognition with John Cameron
1 × $23.00 -
×
 How to Avoid Tax on Your Stock Market Profits with Lee Hadnum
1 × $6.00
How to Avoid Tax on Your Stock Market Profits with Lee Hadnum
1 × $6.00 -
×
 The Prop Trading Code with Brannigan Barrett - Axia Futures
1 × $23.00
The Prop Trading Code with Brannigan Barrett - Axia Futures
1 × $23.00 -
×
 9-Pack of TOS Indicators
1 × $6.00
9-Pack of TOS Indicators
1 × $6.00 -
×
 Guide to Scanning for Potential Stock Trades class with Jeff Bierman
1 × $6.00
Guide to Scanning for Potential Stock Trades class with Jeff Bierman
1 × $6.00 -
×
 Butterfly and Condor Workshop with Aeromir
1 × $15.00
Butterfly and Condor Workshop with Aeromir
1 × $15.00 -
×
 How To Buy with Justin Mamis
1 × $6.00
How To Buy with Justin Mamis
1 × $6.00 -
×
 Foundations of Forex Trading with TradeSmart University
1 × $6.00
Foundations of Forex Trading with TradeSmart University
1 × $6.00 -
×
 Relentless Trading Course Advanced with Ryan Relentless
1 × $5.00
Relentless Trading Course Advanced with Ryan Relentless
1 × $5.00 -
×
 Trading Books with Michael Harris
1 × $6.00
Trading Books with Michael Harris
1 × $6.00 -
×
 Profit.ly - Bitcoin Basics
1 × $6.00
Profit.ly - Bitcoin Basics
1 × $6.00 -
×
 Bond Market Course with The Macro Compass
1 × $15.00
Bond Market Course with The Macro Compass
1 × $15.00 -
×
 Daily Market Review 2009-2012 (Video 16 GB) with David Vallieres
1 × $6.00
Daily Market Review 2009-2012 (Video 16 GB) with David Vallieres
1 × $6.00 -
×
 Compass Trading System with Right Line Trading
1 × $39.00
Compass Trading System with Right Line Trading
1 × $39.00 -
×
 How I Day Trade Course with Traderade
1 × $15.00
How I Day Trade Course with Traderade
1 × $15.00 -
×
 Advanced Spread Trading with Guy Bower - MasterClass Trader
1 × $15.00
Advanced Spread Trading with Guy Bower - MasterClass Trader
1 × $15.00 -
×
 T3 Live - The Simple Art of Trading
1 × $31.00
T3 Live - The Simple Art of Trading
1 × $31.00 -
×
 Supply And Demand Zone Trading Course with Trading180
1 × $5.00
Supply And Demand Zone Trading Course with Trading180
1 × $5.00 -
×
 Heiken Ashi 101
1 × $15.00
Heiken Ashi 101
1 × $15.00 -
×
 Options Trading with Nick & Gareth - Nick Santiago & Gareth Soloway - InTheMoneyStocks
1 × $31.00
Options Trading with Nick & Gareth - Nick Santiago & Gareth Soloway - InTheMoneyStocks
1 × $31.00 -
×
 Options Trading & Ultimate MasterClass With Tyrone Abela - FX Evolution
1 × $54.00
Options Trading & Ultimate MasterClass With Tyrone Abela - FX Evolution
1 × $54.00 -
×
 DFX Scalping Strategy Course with Disciplined FX
1 × $23.00
DFX Scalping Strategy Course with Disciplined FX
1 × $23.00 -
×
 Edz Currency Trading Package with EDZ Trading Academy
1 × $5.00
Edz Currency Trading Package with EDZ Trading Academy
1 × $5.00 -
×
 Fibonnacci Trader WorkShop (Video 2.38 GB) with Dennis Bolze, Thom Hartle
1 × $6.00
Fibonnacci Trader WorkShop (Video 2.38 GB) with Dennis Bolze, Thom Hartle
1 × $6.00 -
×
 8 Year Presidential Election Pattern (Article) with Adam White
1 × $6.00
8 Year Presidential Election Pattern (Article) with Adam White
1 × $6.00 -
×
 Emini, Forex, Stock Course COMPLETE Series Recorded Seminar 2009 - 49 Modules in 3 DVDs (SpecialistTrading.com)
1 × $78.00
Emini, Forex, Stock Course COMPLETE Series Recorded Seminar 2009 - 49 Modules in 3 DVDs (SpecialistTrading.com)
1 × $78.00 -
×
 Traders Winning Edge (Presentation) with Adrienne Laris Toghraie
1 × $6.00
Traders Winning Edge (Presentation) with Adrienne Laris Toghraie
1 × $6.00 -
×
 The Crash of 1997 (Article) with Hans Hannula
1 × $6.00
The Crash of 1997 (Article) with Hans Hannula
1 × $6.00 -
×
 Strategy, Value and Risk - The Real Options Approach with Jamie Rogers
1 × $6.00
Strategy, Value and Risk - The Real Options Approach with Jamie Rogers
1 × $6.00 -
×
 The Hedge Bundle - SpotGamma Academy with Imran Lakha
1 × $8.00
The Hedge Bundle - SpotGamma Academy with Imran Lakha
1 × $8.00 -
×
 TRADING NFX Course with Andrew NFX
1 × $5.00
TRADING NFX Course with Andrew NFX
1 × $5.00 -
×
 ICT Prodigy Trading Course – $650K in Payouts with Alex Solignani
1 × $15.00
ICT Prodigy Trading Course – $650K in Payouts with Alex Solignani
1 × $15.00 -
×
 Studies in Stock Speculation (Volume I & II) with H.J.Wolf
1 × $6.00
Studies in Stock Speculation (Volume I & II) with H.J.Wolf
1 × $6.00 -
×
 Smart Money Concepts with MFX Trading
1 × $13.00
Smart Money Concepts with MFX Trading
1 × $13.00 -
×
 7 Day FX Mastery Course with Market Masters
1 × $6.00
7 Day FX Mastery Course with Market Masters
1 × $6.00 -
×
 P.A.T Trading Course (Low Video Quality) with Martin Cole
1 × $6.00
P.A.T Trading Course (Low Video Quality) with Martin Cole
1 × $6.00 -
×
 Scalp Strategy and Flipping Small Accounts with Opes Trading Group
1 × $5.00
Scalp Strategy and Flipping Small Accounts with Opes Trading Group
1 × $5.00 -
×
 All About Bonds & Mutual Funds with Esme Faerber
1 × $6.00
All About Bonds & Mutual Funds with Esme Faerber
1 × $6.00 -
×
 AI For Traders with Trading Markets
1 × $31.00
AI For Traders with Trading Markets
1 × $31.00 -
×
 TradeCraft: Your Path to Peak Performance Trading By Adam Grimes
1 × $15.00
TradeCraft: Your Path to Peak Performance Trading By Adam Grimes
1 × $15.00

Reading & Understanding Charts with Andrew Baxter
$6.00
File Size: 311MB
Delivery Time: 1–12 hours
Media Type: Online Course
Content Proof: Watch Here!
You may check content proof of “Reading & Understanding Chartsb with Andrew Baxter” below:

Reading & Understanding Charts with Andrew Baxter
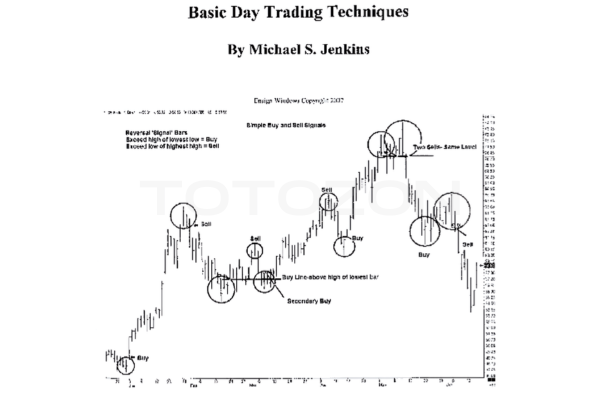
Introduction to Chart Reading
Charts are essential tools for traders, providing visual representations of market data. Andrew Baxter, a renowned trader and educator, shares his expertise on how to read and understand charts effectively. This article will guide you through the basics and advanced techniques of chart reading, helping you make informed trading decisions.
What are Trading Charts?
Definition and Purpose
Trading charts are graphical representations of price movements over time. They help traders analyze trends, identify patterns, and make predictions about future price movements.
Importance of Chart Reading
Understanding charts is crucial for making data-driven decisions in trading. It reduces emotional trading and enhances your ability to spot opportunities and risks.
Types of Trading Charts
1. Line Charts
Line charts are the simplest form of trading charts, showing the closing prices over a period. They provide a clear view of the overall trend but lack detailed information.
2. Bar Charts
Bar charts display the opening, closing, high, and low prices for each period. They offer more information than line charts and help in understanding price volatility.
3. Candlestick Charts
Candlestick charts are popular due to their detailed and visually appealing format. Each candlestick shows the opening, closing, high, and low prices, making it easier to identify market sentiment.
Understanding Candlestick Charts
Components of a Candlestick
- Body: The filled part showing the opening and closing prices.
- Wicks/Shadows: The thin lines representing the high and low prices.
- Color: Indicates whether the closing price was higher (typically green) or lower (typically red) than the opening price.
Common Candlestick Patterns
1. Doji
A Doji occurs when the opening and closing prices are nearly the same, indicating indecision in the market.
2. Hammer
A Hammer has a small body with a long lower wick, suggesting a potential reversal from a downtrend.
3. Engulfing Pattern
An Engulfing pattern occurs when a larger candlestick completely engulfs the previous smaller candlestick, signaling a potential reversal.
Key Chart Patterns
1. Head and Shoulders
This pattern indicates a reversal and is formed by a peak (head) flanked by two smaller peaks (shoulders).
2. Double Top and Double Bottom
These patterns signal a potential reversal. A double top indicates a bearish reversal, while a double bottom suggests a bullish reversal.
3. Triangles
Triangles are continuation patterns that show a period of consolidation before the price continues in the direction of the previous trend.
Using Technical Indicators
1. Moving Averages
Moving averages smooth out price data to identify trends. Common types include Simple Moving Average (SMA) and Exponential Moving Average (EMA).
2. Relative Strength Index (RSI)
RSI measures the speed and change of price movements, indicating overbought or oversold conditions.
3. Moving Average Convergence Divergence (MACD)
MACD shows the relationship between two moving averages, helping to identify potential buy and sell signals.
Combining Chart Patterns and Indicators
Integrated Analysis
Combining chart patterns with technical indicators enhances the reliability of trading signals. For example, confirming a head and shoulders pattern with RSI divergence can provide a stronger signal.
Practical Application
Use a combination of patterns and indicators to develop a comprehensive trading strategy. This approach helps in making more informed and confident trading decisions.
Advanced Chart Reading Techniques
1. Fibonacci Retracement
Fibonacci retracement levels indicate potential support and resistance levels based on the Fibonacci sequence.
2. Volume Analysis
Volume analysis involves examining the number of shares traded to confirm the strength of a price movement or trend.
3. Divergence
Divergence occurs when the price moves in the opposite direction of an indicator, signaling a potential reversal.
Common Mistakes in Chart Reading
1. Overcomplicating Analysis
Avoid using too many indicators and patterns at once. Focus on a few reliable tools to keep your analysis clear and effective.
2. Ignoring Context
Always consider the broader market context and economic factors. Relying solely on charts without context can lead to misleading conclusions.
3. Emotional Trading
Stick to your analysis and avoid making decisions based on emotions. Emotional trading can undermine even the best chart reading skills.
Benefits of Mastering Chart Reading
1. Improved Decision Making
Accurate chart reading helps you make informed decisions, reducing the risk of losses and increasing the potential for gains.
2. Enhanced Trading Strategy
Understanding charts allows you to develop and refine your trading strategies, making them more effective and adaptable.
3. Increased Confidence
With better chart reading skills, you gain confidence in your trading decisions, leading to more consistent performance.
Conclusion
Reading and understanding charts with insights from Andrew Baxter can significantly improve your trading performance. By mastering various chart types, patterns, and technical indicators, you can make more informed decisions and develop robust trading strategies. Embrace these principles, continuously practice, and refine your skills to become a proficient trader.
Frequently Asked Questions:
What are the main types of trading charts?
The main types are line charts, bar charts, and candlestick charts.
Why are candlestick charts popular?
Candlestick charts are popular due to their detailed and visually appealing format, making it easier to identify market sentiment.
What are some common candlestick patterns?
Common patterns include Doji, Hammer, and Engulfing patterns.
How can technical indicators enhance chart reading?
Technical indicators like moving averages, RSI, and MACD help identify trends, momentum, and potential buy/sell signals.
What are some advanced chart reading techniques?
Advanced techniques include Fibonacci retracement, volume analysis, and divergence.
Be the first to review “Reading & Understanding Charts with Andrew Baxter”
You must be logged in to post a review.
Related products
Original price was: $700.00.$39.00Current price is: $39.00.

Forex Trading
Original price was: $797.00.$10.00Current price is: $10.00.
Forex Trading
Original price was: $2,995.00.$31.00Current price is: $31.00.

Original price was: $139.00.$23.00Current price is: $23.00.
Forex Trading
Original price was: $249.00.$15.00Current price is: $15.00.
Forex Trading
Original price was: $500.00.$5.00Current price is: $5.00.

Original price was: $299.00.$8.00Current price is: $8.00.

Forex Trading
Quantamentals – The Next Great Forefront Of Trading and Investing with Trading Markets
Original price was: $1,495.00.$8.00Current price is: $8.00.

Forex Trading
Original price was: $850.00.$23.00Current price is: $23.00.
Original price was: $895.00.$15.00Current price is: $15.00.
Forex Trading
Original price was: $550.00.$5.00Current price is: $5.00.
Forex Trading
Original price was: $1,898.00.$10.00Current price is: $10.00.

Forex Trading
Original price was: $2,997.00.$23.00Current price is: $23.00.

Original price was: $197.00.$5.00Current price is: $5.00.
Original price was: $310.00.$23.00Current price is: $23.00.
Original price was: $1,200.00.$23.00Current price is: $23.00.
Forex Trading
Original price was: $799.00.$15.00Current price is: $15.00.
Forex Trading
Original price was: $1,098.00.$39.00Current price is: $39.00.

Original price was: $997.00.$8.00Current price is: $8.00.

Original price was: $497.00.$11.00Current price is: $11.00.

Reviews
There are no reviews yet.