-
×
 How Stocks Work with David L.Scott
1 × $6.00
How Stocks Work with David L.Scott
1 × $6.00 -
×
 TradeCraft: Your Path to Peak Performance Trading By Adam Grimes
1 × $15.00
TradeCraft: Your Path to Peak Performance Trading By Adam Grimes
1 × $15.00 -
×
 Best of the Best: Collars with Amy Meissner & Scott Ruble
1 × $15.00
Best of the Best: Collars with Amy Meissner & Scott Ruble
1 × $15.00 -
×
 Swing Trading College IX 2010 with Larry Connors
1 × $15.00
Swing Trading College IX 2010 with Larry Connors
1 × $15.00 -
×
 My General Counsel™
1 × $23.00
My General Counsel™
1 × $23.00 -
×
 How to Buy Stocks Before They Skyrocket
1 × $6.00
How to Buy Stocks Before They Skyrocket
1 × $6.00 -
×
 Order Flow Analysis
1 × $15.00
Order Flow Analysis
1 × $15.00 -
×
 London Close Trade 2.0 with Shirley Hudson & Vic Noble - Forex Mentor
1 × $5.00
London Close Trade 2.0 with Shirley Hudson & Vic Noble - Forex Mentor
1 × $5.00 -
×
 Gap Trading for Stock and Options Traders with Damon Verial
1 × $6.00
Gap Trading for Stock and Options Traders with Damon Verial
1 × $6.00 -
×
 The Indices Orderflow Masterclass with The Forex Scalpers
1 × $23.00
The Indices Orderflow Masterclass with The Forex Scalpers
1 × $23.00 -
×
 Mentfx Paid Mentoship (2021)
1 × $5.00
Mentfx Paid Mentoship (2021)
1 × $5.00 -
×
 The Adventures of the Cycle Hunter. The Analyst with Craig Bttlc
1 × $6.00
The Adventures of the Cycle Hunter. The Analyst with Craig Bttlc
1 × $6.00 -
×
 Advanced Management Strategies - Home Study with Pristine Capital
1 × $27.00
Advanced Management Strategies - Home Study with Pristine Capital
1 × $27.00 -
×
 How You Can Be Right While the Crowd Loses with Jack Bernstein
1 × $6.00
How You Can Be Right While the Crowd Loses with Jack Bernstein
1 × $6.00 -
×
 Time, Price & Pattern with John Crane
1 × $6.00
Time, Price & Pattern with John Crane
1 × $6.00 -
×
 New York Institute of Finance – Futures. A Personal Seminar
1 × $6.00
New York Institute of Finance – Futures. A Personal Seminar
1 × $6.00 -
×
 Derivates Demystified
1 × $6.00
Derivates Demystified
1 × $6.00 -
×
 How To Backtest Bootcamp
1 × $17.00
How To Backtest Bootcamp
1 × $17.00 -
×
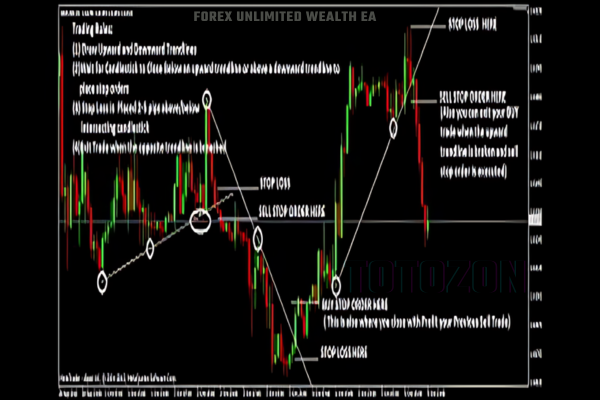 FOREX UNLIMITED WEALTH EA
1 × $6.00
FOREX UNLIMITED WEALTH EA
1 × $6.00 -
×
 Trading Short TermSame Day Trades Sep 2023 with Dan Sheridan & Mark Fenton - Sheridan Options Mentoring
1 × $31.00
Trading Short TermSame Day Trades Sep 2023 with Dan Sheridan & Mark Fenton - Sheridan Options Mentoring
1 × $31.00 -
×
 ProfileTraders - Swing and Price Analysis (May 2014)
1 × $6.00
ProfileTraders - Swing and Price Analysis (May 2014)
1 × $6.00 -
×
 Investing in 401k Plans with Cliffsnotes
1 × $6.00
Investing in 401k Plans with Cliffsnotes
1 × $6.00 -
×
 Mastering the Geometry of Market Energy with Charles Drummond
1 × $6.00
Mastering the Geometry of Market Energy with Charles Drummond
1 × $6.00 -
×
 Fundamentals 101: A Comprehensive Guide to Macroeconomic, Industry, and Financial Statement Analysis Class with Jeff Bierman
1 × $6.00
Fundamentals 101: A Comprehensive Guide to Macroeconomic, Industry, and Financial Statement Analysis Class with Jeff Bierman
1 × $6.00 -
×
 Investment Fables with Aswath Damodaran
1 × $6.00
Investment Fables with Aswath Damodaran
1 × $6.00 -
×
 Traders World Past Issue Articles on CD with Magazine
1 × $6.00
Traders World Past Issue Articles on CD with Magazine
1 × $6.00 -
×
 No Bull Investing with Jack Bernstein
1 × $6.00
No Bull Investing with Jack Bernstein
1 × $6.00 -
×
 How to be a Sector Investor with Larry Hungerford & Steve Hungerford
1 × $4.00
How to be a Sector Investor with Larry Hungerford & Steve Hungerford
1 × $4.00 -
×
 Peter Borish Online Trader Program
1 × $15.00
Peter Borish Online Trader Program
1 × $15.00 -
×
 Intro To Trading - 3 Module Bundle
1 × $23.00
Intro To Trading - 3 Module Bundle
1 × $23.00 -
×
 Fractal Markets FX (SMC)
1 × $5.00
Fractal Markets FX (SMC)
1 × $5.00 -
×
 CANDLESTICKS APPLIED with Steve Nison & Syl Desaulniers - Candle Charts
1 × $15.00
CANDLESTICKS APPLIED with Steve Nison & Syl Desaulniers - Candle Charts
1 × $15.00 -
×
 Get to know the VIX Index (aka The Fear Index)
1 × $15.00
Get to know the VIX Index (aka The Fear Index)
1 × $15.00 -
×
 Five Trading Trends of 2005 with Dan Denning
1 × $6.00
Five Trading Trends of 2005 with Dan Denning
1 × $6.00 -
×
 Fibonacci Analysis with Constance Brown
1 × $6.00
Fibonacci Analysis with Constance Brown
1 × $6.00 -
×
 Investing Smart. How to Pick Stocks with Investors Business Daily By Dhun H.Sethna
1 × $4.00
Investing Smart. How to Pick Stocks with Investors Business Daily By Dhun H.Sethna
1 × $4.00 -
×
 Ron Wagner – Creating a Profitable Trading & Investing Plan. 6 Key Components with Pristine
1 × $4.00
Ron Wagner – Creating a Profitable Trading & Investing Plan. 6 Key Components with Pristine
1 × $4.00 -
×
 Lifespan Investing with Clifford Pistolese
1 × $6.00
Lifespan Investing with Clifford Pistolese
1 × $6.00 -
×
 How the Stock Market Works with Ramon DeGennaro
1 × $5.00
How the Stock Market Works with Ramon DeGennaro
1 × $5.00 -
×
 Day Trading and Swing Trading Futures with Price Action by Humberto Malaspina
1 × $5.00
Day Trading and Swing Trading Futures with Price Action by Humberto Malaspina
1 × $5.00 -
×
 Inside the House of Money (2006) with Steven Drobny
1 × $6.00
Inside the House of Money (2006) with Steven Drobny
1 × $6.00 -
×
 Order flow self-study training program with iMFtracker
1 × $10.00
Order flow self-study training program with iMFtracker
1 × $10.00 -
×
 Steidlmayer On Markets. A New Approach to Trading with J.Peter Steidlmayer
1 × $6.00
Steidlmayer On Markets. A New Approach to Trading with J.Peter Steidlmayer
1 × $6.00 -
×
 $20 – 52k 20 pips a day challange with Rafał Zuchowicz - TopMasterTrader
1 × $5.00
$20 – 52k 20 pips a day challange with Rafał Zuchowicz - TopMasterTrader
1 × $5.00

Reading & Understanding Charts with Andrew Baxter
$6.00
File Size: 311MB
Delivery Time: 1–12 hours
Media Type: Online Course
Content Proof: Watch Here!
You may check content proof of “Reading & Understanding Chartsb with Andrew Baxter” below:

Reading & Understanding Charts with Andrew Baxter
Introduction to Chart Reading
Charts are essential tools for traders, providing visual representations of market data. Andrew Baxter, a renowned trader and educator, shares his expertise on how to read and understand charts effectively. This article will guide you through the basics and advanced techniques of chart reading, helping you make informed trading decisions.
What are Trading Charts?
Definition and Purpose
Trading charts are graphical representations of price movements over time. They help traders analyze trends, identify patterns, and make predictions about future price movements.
Importance of Chart Reading
Understanding charts is crucial for making data-driven decisions in trading. It reduces emotional trading and enhances your ability to spot opportunities and risks.
Types of Trading Charts
1. Line Charts
Line charts are the simplest form of trading charts, showing the closing prices over a period. They provide a clear view of the overall trend but lack detailed information.
2. Bar Charts
Bar charts display the opening, closing, high, and low prices for each period. They offer more information than line charts and help in understanding price volatility.
3. Candlestick Charts
Candlestick charts are popular due to their detailed and visually appealing format. Each candlestick shows the opening, closing, high, and low prices, making it easier to identify market sentiment.
Understanding Candlestick Charts
Components of a Candlestick
- Body: The filled part showing the opening and closing prices.
- Wicks/Shadows: The thin lines representing the high and low prices.
- Color: Indicates whether the closing price was higher (typically green) or lower (typically red) than the opening price.
Common Candlestick Patterns
1. Doji
A Doji occurs when the opening and closing prices are nearly the same, indicating indecision in the market.
2. Hammer
A Hammer has a small body with a long lower wick, suggesting a potential reversal from a downtrend.
3. Engulfing Pattern
An Engulfing pattern occurs when a larger candlestick completely engulfs the previous smaller candlestick, signaling a potential reversal.
Key Chart Patterns
1. Head and Shoulders
This pattern indicates a reversal and is formed by a peak (head) flanked by two smaller peaks (shoulders).
2. Double Top and Double Bottom
These patterns signal a potential reversal. A double top indicates a bearish reversal, while a double bottom suggests a bullish reversal.
3. Triangles
Triangles are continuation patterns that show a period of consolidation before the price continues in the direction of the previous trend.
Using Technical Indicators
1. Moving Averages
Moving averages smooth out price data to identify trends. Common types include Simple Moving Average (SMA) and Exponential Moving Average (EMA).
2. Relative Strength Index (RSI)
RSI measures the speed and change of price movements, indicating overbought or oversold conditions.
3. Moving Average Convergence Divergence (MACD)
MACD shows the relationship between two moving averages, helping to identify potential buy and sell signals.
Combining Chart Patterns and Indicators
Integrated Analysis
Combining chart patterns with technical indicators enhances the reliability of trading signals. For example, confirming a head and shoulders pattern with RSI divergence can provide a stronger signal.
Practical Application
Use a combination of patterns and indicators to develop a comprehensive trading strategy. This approach helps in making more informed and confident trading decisions.
Advanced Chart Reading Techniques
1. Fibonacci Retracement
Fibonacci retracement levels indicate potential support and resistance levels based on the Fibonacci sequence.
2. Volume Analysis
Volume analysis involves examining the number of shares traded to confirm the strength of a price movement or trend.
3. Divergence
Divergence occurs when the price moves in the opposite direction of an indicator, signaling a potential reversal.
Common Mistakes in Chart Reading
1. Overcomplicating Analysis
Avoid using too many indicators and patterns at once. Focus on a few reliable tools to keep your analysis clear and effective.
2. Ignoring Context
Always consider the broader market context and economic factors. Relying solely on charts without context can lead to misleading conclusions.
3. Emotional Trading
Stick to your analysis and avoid making decisions based on emotions. Emotional trading can undermine even the best chart reading skills.
Benefits of Mastering Chart Reading
1. Improved Decision Making
Accurate chart reading helps you make informed decisions, reducing the risk of losses and increasing the potential for gains.
2. Enhanced Trading Strategy
Understanding charts allows you to develop and refine your trading strategies, making them more effective and adaptable.
3. Increased Confidence
With better chart reading skills, you gain confidence in your trading decisions, leading to more consistent performance.
Conclusion
Reading and understanding charts with insights from Andrew Baxter can significantly improve your trading performance. By mastering various chart types, patterns, and technical indicators, you can make more informed decisions and develop robust trading strategies. Embrace these principles, continuously practice, and refine your skills to become a proficient trader.
Frequently Asked Questions:
What are the main types of trading charts?
The main types are line charts, bar charts, and candlestick charts.
Why are candlestick charts popular?
Candlestick charts are popular due to their detailed and visually appealing format, making it easier to identify market sentiment.
What are some common candlestick patterns?
Common patterns include Doji, Hammer, and Engulfing patterns.
How can technical indicators enhance chart reading?
Technical indicators like moving averages, RSI, and MACD help identify trends, momentum, and potential buy/sell signals.
What are some advanced chart reading techniques?
Advanced techniques include Fibonacci retracement, volume analysis, and divergence.
Be the first to review “Reading & Understanding Charts with Andrew Baxter”
You must be logged in to post a review.
Related products

Forex Trading
The Complete Guide to Multiple Time Frame Analysis & Reading Price Action with Aiman Almansoori
Original price was: $1,399.00.$13.00Current price is: $13.00.

Original price was: $139.00.$23.00Current price is: $23.00.

Forex Trading
Original price was: $799.00.$15.00Current price is: $15.00.

Original price was: $299.00.$8.00Current price is: $8.00.

Original price was: $1,849.00.$15.00Current price is: $15.00.

Forex Trading
Original price was: $4,997.00.$27.00Current price is: $27.00.

Forex Trading
Original price was: $550.00.$5.00Current price is: $5.00.

Original price was: $895.00.$15.00Current price is: $15.00.

Original price was: $695.00.$41.00Current price is: $41.00.

Original price was: $497.00.$11.00Current price is: $11.00.

Forex Trading
Original price was: $1,098.00.$39.00Current price is: $39.00.

Forex Trading
Original price was: $500.00.$5.00Current price is: $5.00.
Forex Trading
Original price was: $1,898.00.$10.00Current price is: $10.00.

Original price was: $2,120.00.$15.00Current price is: $15.00.

Original price was: $1,800.00.$54.00Current price is: $54.00.

Original price was: $310.00.$23.00Current price is: $23.00.

Forex Trading
Original price was: $2,000.00.$23.00Current price is: $23.00.

Forex Trading
Original price was: $125.00.$17.00Current price is: $17.00.

Forex Trading
Original price was: $999.00.$15.00Current price is: $15.00.
Original price was: $4,995.00.$15.00Current price is: $15.00.

Reviews
There are no reviews yet.