-
×
 Patterns to Profits with Ryan Mallory - Share Planner
1 × $6.00
Patterns to Profits with Ryan Mallory - Share Planner
1 × $6.00 -
×
 Mechanising Some of the World’s Classic Trading Systems with Murray Ruggiero
1 × $7.00
Mechanising Some of the World’s Classic Trading Systems with Murray Ruggiero
1 × $7.00 -
×
 Essentials in Quantitative Trading QT01 By HangukQuant's
1 × $23.00
Essentials in Quantitative Trading QT01 By HangukQuant's
1 × $23.00 -
×
 The Complete Guide to Multiple Time Frame Analysis & Reading Price Action with Aiman Almansoori
1 × $13.00
The Complete Guide to Multiple Time Frame Analysis & Reading Price Action with Aiman Almansoori
1 × $13.00 -
×
 Order flow self-study training program with iMFtracker
1 × $10.00
Order flow self-study training program with iMFtracker
1 × $10.00 -
×
 Algo Trading Masterclass with Ali Casey - StatOasis
1 × $23.00
Algo Trading Masterclass with Ali Casey - StatOasis
1 × $23.00 -
×
 Online Course: Forex Trading By Fxtc.co
1 × $5.00
Online Course: Forex Trading By Fxtc.co
1 × $5.00 -
×
 AI For Traders with Trading Markets
1 × $31.00
AI For Traders with Trading Markets
1 × $31.00 -
×
 Best of the Best: Collars with Amy Meissner & Scott Ruble
1 × $15.00
Best of the Best: Collars with Amy Meissner & Scott Ruble
1 × $15.00 -
×
 Simpler Traders - Ultimate Guide to Debit Spreads (PREMIUM)
1 × $39.00
Simpler Traders - Ultimate Guide to Debit Spreads (PREMIUM)
1 × $39.00 -
×
 TradeCraft: Your Path to Peak Performance Trading By Adam Grimes
1 × $15.00
TradeCraft: Your Path to Peak Performance Trading By Adam Grimes
1 × $15.00 -
×
 Patterns of Speculation with Bertrand M.Roehner
1 × $6.00
Patterns of Speculation with Bertrand M.Roehner
1 × $6.00 -
×
 White Phoenix’s The Smart (Money) Approach to Trading with Jayson Casper
1 × $39.00
White Phoenix’s The Smart (Money) Approach to Trading with Jayson Casper
1 × $39.00 -
×
 Secrets of An Electronic Futures Trader with Larry Levin
1 × $6.00
Secrets of An Electronic Futures Trader with Larry Levin
1 × $6.00 -
×
 Butterfly and Condor Workshop with Aeromir
1 × $15.00
Butterfly and Condor Workshop with Aeromir
1 × $15.00 -
×
 W. D Gann 's Square Of 9 Applied To Modern Markets with Sean Avidar - Hexatrade350
1 × $23.00
W. D Gann 's Square Of 9 Applied To Modern Markets with Sean Avidar - Hexatrade350
1 × $23.00 -
×
 Orderflows Gems 2-Private Sessions with Mike Valtos
1 × $20.00
Orderflows Gems 2-Private Sessions with Mike Valtos
1 × $20.00 -
×
 Quantamentals - The Next Great Forefront Of Trading and Investing with Trading Markets
1 × $8.00
Quantamentals - The Next Great Forefront Of Trading and Investing with Trading Markets
1 × $8.00 -
×
 Mutual Funds for Dummies (6th edition) with Eric Tyson
1 × $6.00
Mutual Funds for Dummies (6th edition) with Eric Tyson
1 × $6.00 -
×
 Raghee’s Winners Circle Course
1 × $6.00
Raghee’s Winners Circle Course
1 × $6.00 -
×
 INVESTOPEDIA - BECOME A DAY TRADER
1 × $15.00
INVESTOPEDIA - BECOME A DAY TRADER
1 × $15.00 -
×
 Money Management Strategies for Serious Traders with David Stendahl
1 × $6.00
Money Management Strategies for Serious Traders with David Stendahl
1 × $6.00 -
×
 Mesa & Trading Market Cycles (1st Edition) with John Ehlers & Perry Kaufman
1 × $6.00
Mesa & Trading Market Cycles (1st Edition) with John Ehlers & Perry Kaufman
1 × $6.00 -
×
 Pairs Trading: Quantitative Methods and Analysis with Ganapathy Vidyamurthy
1 × $6.00
Pairs Trading: Quantitative Methods and Analysis with Ganapathy Vidyamurthy
1 × $6.00 -
×
 Crypto Trading Academy with Cheeky Investor - Aussie Day Trader
1 × $13.00
Crypto Trading Academy with Cheeky Investor - Aussie Day Trader
1 × $13.00 -
×
 The Key to Profits in Tough Times
1 × $6.00
The Key to Profits in Tough Times
1 × $6.00 -
×
 Scalp Strategy and Flipping Small Accounts with Opes Trading Group
1 × $5.00
Scalp Strategy and Flipping Small Accounts with Opes Trading Group
1 × $5.00 -
×
 Trading on Momentum with Ken Wolff
1 × $6.00
Trading on Momentum with Ken Wolff
1 × $6.00 -
×
 Golden Pips Generator - DMA HACK with Hooman
1 × $62.00
Golden Pips Generator - DMA HACK with Hooman
1 × $62.00 -
×
 Note Buying Blueprint with Scott Carson - We Close Notes
1 × $6.00
Note Buying Blueprint with Scott Carson - We Close Notes
1 × $6.00 -
×
 Gaining an Edge when you Trade the S&P Futures with Carolyn Boroden
1 × $6.00
Gaining an Edge when you Trade the S&P Futures with Carolyn Boroden
1 × $6.00 -
×
 Matrix Spread Options Trading Course with Base Camp Trading
1 × $31.00
Matrix Spread Options Trading Course with Base Camp Trading
1 × $31.00 -
×
 SQX Mentorship with Tip Toe Hippo
1 × $23.00
SQX Mentorship with Tip Toe Hippo
1 × $23.00 -
×
 MTI - Basics UTP
1 × $6.00
MTI - Basics UTP
1 × $6.00 -
×
 MTA Master Trader Academy with Junior Charles
1 × $5.00
MTA Master Trader Academy with Junior Charles
1 × $5.00 -
×
 Advanced Spread Trading with Guy Bower - MasterClass Trader
1 × $15.00
Advanced Spread Trading with Guy Bower - MasterClass Trader
1 × $15.00 -
×
 GMMA Trend Volatility Management with Dary Guppy
1 × $6.00
GMMA Trend Volatility Management with Dary Guppy
1 × $6.00 -
×
 High Probability Trading Using Elliott Wave And Fibonacci Analysis withVic Patel - Forex Training Group
1 × $10.00
High Probability Trading Using Elliott Wave And Fibonacci Analysis withVic Patel - Forex Training Group
1 × $10.00 -
×
 Market Internals & Intraday Timing Webinar
1 × $6.00
Market Internals & Intraday Timing Webinar
1 × $6.00 -
×
 The Indices Orderflow Masterclass with The Forex Scalpers
1 × $23.00
The Indices Orderflow Masterclass with The Forex Scalpers
1 × $23.00 -
×
 The Trading Blueprint with Brad Goh - The Trading Geek
1 × $5.00
The Trading Blueprint with Brad Goh - The Trading Geek
1 × $5.00 -
×
 How To Read The Market Professionally with TradeSmart
1 × $27.00
How To Read The Market Professionally with TradeSmart
1 × $27.00 -
×
 The Orderflows Trade Opportunities Encyclopedia with Michael Valtos
1 × $8.00
The Orderflows Trade Opportunities Encyclopedia with Michael Valtos
1 × $8.00 -
×
 Impulse Trading System with Base Camp Trading
1 × $54.00
Impulse Trading System with Base Camp Trading
1 × $54.00 -
×
 The Prop Trading Code with Brannigan Barrett - Axia Futures
1 × $23.00
The Prop Trading Code with Brannigan Barrett - Axia Futures
1 × $23.00 -
×
 International Mergers & Acquisitions Activity Since 1990 with Greg Gregoriou & Luc Renneboog
1 × $6.00
International Mergers & Acquisitions Activity Since 1990 with Greg Gregoriou & Luc Renneboog
1 × $6.00 -
×
 Art of Yen Course (Feb 2014)
1 × $23.00
Art of Yen Course (Feb 2014)
1 × $23.00 -
×
 ICT Prodigy Trading Course – $650K in Payouts with Alex Solignani
1 × $15.00
ICT Prodigy Trading Course – $650K in Payouts with Alex Solignani
1 × $15.00 -
×
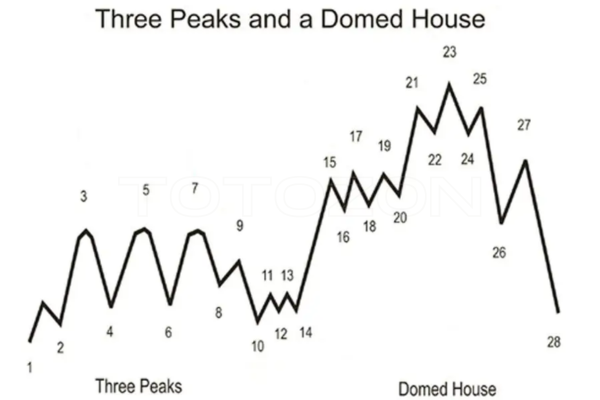 George Lindays. 3 Peaks and the Domed House Revised with Barclay T.Leib
1 × $6.00
George Lindays. 3 Peaks and the Domed House Revised with Barclay T.Leib
1 × $6.00 -
×
 Volume Profile Video Course with Trader Dale
1 × $8.00
Volume Profile Video Course with Trader Dale
1 × $8.00 -
×
 Ultimate Trading Course with Dodgy's Dungeon
1 × $8.00
Ultimate Trading Course with Dodgy's Dungeon
1 × $8.00 -
×
 The Orderflow Masterclass with PrimeTrading
1 × $17.00
The Orderflow Masterclass with PrimeTrading
1 × $17.00 -
×
 The Naked Eye: Raw Data Analytics with Edgar Torres - Raw Data Analytics
1 × $8.00
The Naked Eye: Raw Data Analytics with Edgar Torres - Raw Data Analytics
1 × $8.00 -
×
 Forex Trader Package 2010
1 × $15.00
Forex Trader Package 2010
1 × $15.00 -
×
 Bond Market Course with The Macro Compass
1 × $15.00
Bond Market Course with The Macro Compass
1 × $15.00 -
×
 Options Trading & Ultimate MasterClass With Tyrone Abela - FX Evolution
1 × $54.00
Options Trading & Ultimate MasterClass With Tyrone Abela - FX Evolution
1 × $54.00 -
×
 Simple Forex Profits with Rayy Bannzz
1 × $31.00
Simple Forex Profits with Rayy Bannzz
1 × $31.00 -
×
 Vega Modified Butterfly Class with Jay Bailey - Sheridan Options Mentoring
1 × $31.00
Vega Modified Butterfly Class with Jay Bailey - Sheridan Options Mentoring
1 × $31.00 -
×
 Perfect Publishing System Elite with Johnny Andrews
1 × $6.00
Perfect Publishing System Elite with Johnny Andrews
1 × $6.00 -
×
 Trading Short TermSame Day Trades Sep 2023 with Dan Sheridan & Mark Fenton - Sheridan Options Mentoring
1 × $31.00
Trading Short TermSame Day Trades Sep 2023 with Dan Sheridan & Mark Fenton - Sheridan Options Mentoring
1 × $31.00 -
×
 WondaFX Signature Strategy with WondaFX
1 × $5.00
WondaFX Signature Strategy with WondaFX
1 × $5.00 -
×
 Fundamentals Trading
1 × $6.00
Fundamentals Trading
1 × $6.00 -
×
 Multi-Squeeze Indicator For TOS
1 × $31.00
Multi-Squeeze Indicator For TOS
1 × $31.00 -
×
 Forecast 2024 Clarification with Larry Williams
1 × $15.00
Forecast 2024 Clarification with Larry Williams
1 × $15.00 -
×
 Foundation & Application of the Market with Jim Dalton - JimDalton Trading
1 × $5.00
Foundation & Application of the Market with Jim Dalton - JimDalton Trading
1 × $5.00 -
×
 The Ultimate Guide to the Stealth Forex System (stealthforexguide.com)
1 × $6.00
The Ultimate Guide to the Stealth Forex System (stealthforexguide.com)
1 × $6.00 -
×
 The Best Option Trading Course with David Jaffee - Best Stock Strategy
1 × $15.00
The Best Option Trading Course with David Jaffee - Best Stock Strategy
1 × $15.00 -
×
 Random Walk Trading - J.L.Lord - Option Greeks for Profit
1 × $15.00
Random Walk Trading - J.L.Lord - Option Greeks for Profit
1 × $15.00 -
×
 Home Run Options Trading Course with Dave Aquino - Base Camp Trading
1 × $11.00
Home Run Options Trading Course with Dave Aquino - Base Camp Trading
1 × $11.00 -
×
 Crystal Ball Pack PLUS bonus Live Trade By Pat Mitchell - Trick Trades
1 × $20.00
Crystal Ball Pack PLUS bonus Live Trade By Pat Mitchell - Trick Trades
1 × $20.00 -
×
 European Members - March 2023 with Stockbee
1 × $5.00
European Members - March 2023 with Stockbee
1 × $5.00 -
×
 The A14 Weekly Option Strategy Workshop with Amy Meissner
1 × $23.00
The A14 Weekly Option Strategy Workshop with Amy Meissner
1 × $23.00 -
×
 Mastering Candlestick Charts II with Greg Capra
1 × $6.00
Mastering Candlestick Charts II with Greg Capra
1 × $6.00 -
×
 DVD Series Trading Course
1 × $15.00
DVD Series Trading Course
1 × $15.00 -
×
 TRADING NFX Course with Andrew NFX
1 × $5.00
TRADING NFX Course with Andrew NFX
1 × $5.00 -
×
 Learn Investing & Trading with Danny Devan
1 × $23.00
Learn Investing & Trading with Danny Devan
1 × $23.00 -
×
 $20 – 52k 20 pips a day challange with Rafał Zuchowicz - TopMasterTrader
1 × $5.00
$20 – 52k 20 pips a day challange with Rafał Zuchowicz - TopMasterTrader
1 × $5.00 -
×
 Stop Being the Stock Market Plankton with Idan Gabrieli
1 × $6.00
Stop Being the Stock Market Plankton with Idan Gabrieli
1 × $6.00 -
×
 Metals Webinar
1 × $6.00
Metals Webinar
1 × $6.00 -
×
 Mastering Trading Stress with Ari Kiev
1 × $6.00
Mastering Trading Stress with Ari Kiev
1 × $6.00 -
×
 Inner Cicle Trader - ICT Methods with Michael Huddleston
1 × $5.00
Inner Cicle Trader - ICT Methods with Michael Huddleston
1 × $5.00 -
×
 Strategy, Value and Risk - The Real Options Approach with Jamie Rogers
1 × $6.00
Strategy, Value and Risk - The Real Options Approach with Jamie Rogers
1 × $6.00

Reading & Understanding Charts with Andrew Baxter
$6.00
File Size: 311MB
Delivery Time: 1–12 hours
Media Type: Online Course
Content Proof: Watch Here!
You may check content proof of “Reading & Understanding Chartsb with Andrew Baxter” below:

Reading & Understanding Charts with Andrew Baxter
Introduction to Chart Reading
Charts are essential tools for traders, providing visual representations of market data. Andrew Baxter, a renowned trader and educator, shares his expertise on how to read and understand charts effectively. This article will guide you through the basics and advanced techniques of chart reading, helping you make informed trading decisions.
What are Trading Charts?
Definition and Purpose
Trading charts are graphical representations of price movements over time. They help traders analyze trends, identify patterns, and make predictions about future price movements.
Importance of Chart Reading
Understanding charts is crucial for making data-driven decisions in trading. It reduces emotional trading and enhances your ability to spot opportunities and risks.
Types of Trading Charts
1. Line Charts
Line charts are the simplest form of trading charts, showing the closing prices over a period. They provide a clear view of the overall trend but lack detailed information.
2. Bar Charts
Bar charts display the opening, closing, high, and low prices for each period. They offer more information than line charts and help in understanding price volatility.
3. Candlestick Charts
Candlestick charts are popular due to their detailed and visually appealing format. Each candlestick shows the opening, closing, high, and low prices, making it easier to identify market sentiment.
Understanding Candlestick Charts
Components of a Candlestick
- Body: The filled part showing the opening and closing prices.
- Wicks/Shadows: The thin lines representing the high and low prices.
- Color: Indicates whether the closing price was higher (typically green) or lower (typically red) than the opening price.
Common Candlestick Patterns
1. Doji
A Doji occurs when the opening and closing prices are nearly the same, indicating indecision in the market.
2. Hammer
A Hammer has a small body with a long lower wick, suggesting a potential reversal from a downtrend.
3. Engulfing Pattern
An Engulfing pattern occurs when a larger candlestick completely engulfs the previous smaller candlestick, signaling a potential reversal.
Key Chart Patterns
1. Head and Shoulders
This pattern indicates a reversal and is formed by a peak (head) flanked by two smaller peaks (shoulders).
2. Double Top and Double Bottom
These patterns signal a potential reversal. A double top indicates a bearish reversal, while a double bottom suggests a bullish reversal.
3. Triangles
Triangles are continuation patterns that show a period of consolidation before the price continues in the direction of the previous trend.
Using Technical Indicators
1. Moving Averages
Moving averages smooth out price data to identify trends. Common types include Simple Moving Average (SMA) and Exponential Moving Average (EMA).
2. Relative Strength Index (RSI)
RSI measures the speed and change of price movements, indicating overbought or oversold conditions.
3. Moving Average Convergence Divergence (MACD)
MACD shows the relationship between two moving averages, helping to identify potential buy and sell signals.
Combining Chart Patterns and Indicators
Integrated Analysis
Combining chart patterns with technical indicators enhances the reliability of trading signals. For example, confirming a head and shoulders pattern with RSI divergence can provide a stronger signal.
Practical Application
Use a combination of patterns and indicators to develop a comprehensive trading strategy. This approach helps in making more informed and confident trading decisions.
Advanced Chart Reading Techniques
1. Fibonacci Retracement
Fibonacci retracement levels indicate potential support and resistance levels based on the Fibonacci sequence.
2. Volume Analysis
Volume analysis involves examining the number of shares traded to confirm the strength of a price movement or trend.
3. Divergence
Divergence occurs when the price moves in the opposite direction of an indicator, signaling a potential reversal.
Common Mistakes in Chart Reading
1. Overcomplicating Analysis
Avoid using too many indicators and patterns at once. Focus on a few reliable tools to keep your analysis clear and effective.
2. Ignoring Context
Always consider the broader market context and economic factors. Relying solely on charts without context can lead to misleading conclusions.
3. Emotional Trading
Stick to your analysis and avoid making decisions based on emotions. Emotional trading can undermine even the best chart reading skills.
Benefits of Mastering Chart Reading
1. Improved Decision Making
Accurate chart reading helps you make informed decisions, reducing the risk of losses and increasing the potential for gains.
2. Enhanced Trading Strategy
Understanding charts allows you to develop and refine your trading strategies, making them more effective and adaptable.
3. Increased Confidence
With better chart reading skills, you gain confidence in your trading decisions, leading to more consistent performance.
Conclusion
Reading and understanding charts with insights from Andrew Baxter can significantly improve your trading performance. By mastering various chart types, patterns, and technical indicators, you can make more informed decisions and develop robust trading strategies. Embrace these principles, continuously practice, and refine your skills to become a proficient trader.
Frequently Asked Questions:
What are the main types of trading charts?
The main types are line charts, bar charts, and candlestick charts.
Why are candlestick charts popular?
Candlestick charts are popular due to their detailed and visually appealing format, making it easier to identify market sentiment.
What are some common candlestick patterns?
Common patterns include Doji, Hammer, and Engulfing patterns.
How can technical indicators enhance chart reading?
Technical indicators like moving averages, RSI, and MACD help identify trends, momentum, and potential buy/sell signals.
What are some advanced chart reading techniques?
Advanced techniques include Fibonacci retracement, volume analysis, and divergence.
Be the first to review “Reading & Understanding Charts with Andrew Baxter”
You must be logged in to post a review.
Related products
Original price was: $700.00.$39.00Current price is: $39.00.
Forex Trading
Quantamentals – The Next Great Forefront Of Trading and Investing with Trading Markets
Original price was: $1,495.00.$8.00Current price is: $8.00.
Forex Trading
Original price was: $125.00.$17.00Current price is: $17.00.
Original price was: $649.00.$20.00Current price is: $20.00.
Original price was: $310.00.$23.00Current price is: $23.00.

Original price was: $695.00.$41.00Current price is: $41.00.
Original price was: $999.00.$5.00Current price is: $5.00.
Forex Trading
Original price was: $2,000.00.$23.00Current price is: $23.00.
Original price was: $997.00.$13.00Current price is: $13.00.
Forex Trading
Original price was: $799.00.$15.00Current price is: $15.00.
Original price was: $497.00.$31.00Current price is: $31.00.
Original price was: $1,849.00.$15.00Current price is: $15.00.
Forex Trading
Original price was: $1,898.00.$10.00Current price is: $10.00.
Original price was: $895.00.$15.00Current price is: $15.00.
Forex Trading
Original price was: $2,997.00.$23.00Current price is: $23.00.
Forex Trading
Original price was: $797.00.$10.00Current price is: $10.00.
Original price was: $4,995.00.$15.00Current price is: $15.00.
Original price was: $1,800.00.$54.00Current price is: $54.00.
Original price was: $799.00.$15.00Current price is: $15.00.

Forex Trading
Original price was: $999.00.$15.00Current price is: $15.00.

Reviews
There are no reviews yet.