-
×
 30 Trading Classics with 3T Live
1 × $5.00
30 Trading Classics with 3T Live
1 × $5.00 -
×
 Apteros Trading Fall Intensive 2021 - Trading Intensive
1 × $54.00
Apteros Trading Fall Intensive 2021 - Trading Intensive
1 × $54.00 -
×
 Squeeze the Markets with Markay Latimer
1 × $6.00
Squeeze the Markets with Markay Latimer
1 × $6.00 -
×
 Best of Livestock with Timothy Sykes
1 × $5.00
Best of Livestock with Timothy Sykes
1 × $5.00 -
×
 Order flow self-study training program with iMFtracker
1 × $10.00
Order flow self-study training program with iMFtracker
1 × $10.00 -
×
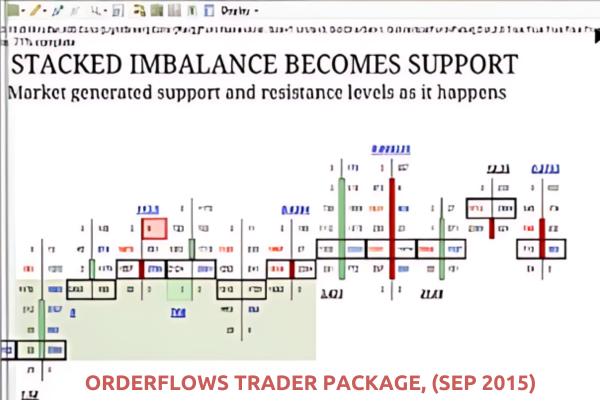 OrderFlows Trader Package, (Sep 2015)
1 × $54.00
OrderFlows Trader Package, (Sep 2015)
1 × $54.00 -
×
 The Prop Trading Code with Brannigan Barrett - Axia Futures
1 × $23.00
The Prop Trading Code with Brannigan Barrett - Axia Futures
1 × $23.00 -
×
 Who is Afraid of Word Trade Organization with Kent Jones
1 × $6.00
Who is Afraid of Word Trade Organization with Kent Jones
1 × $6.00 -
×
 Technical Analysis for Short-Term Traders
1 × $6.00
Technical Analysis for Short-Term Traders
1 × $6.00 -
×
 White Phoenix’s The Smart (Money) Approach to Trading with Jayson Casper
1 × $39.00
White Phoenix’s The Smart (Money) Approach to Trading with Jayson Casper
1 × $39.00 -
×
 Developing Profitable Systems from Discretionary to Mechanical with Fred Shutzman
1 × $6.00
Developing Profitable Systems from Discretionary to Mechanical with Fred Shutzman
1 × $6.00 -
×
 Futures Trading Secrets Home Study with Bill McCready
1 × $6.00
Futures Trading Secrets Home Study with Bill McCready
1 × $6.00 -
×
 Dumb Money: Adventures of a Day Trader with Joey Anuff
1 × $6.00
Dumb Money: Adventures of a Day Trader with Joey Anuff
1 × $6.00 -
×
 Quant Edge with T3 Live
1 × $6.00
Quant Edge with T3 Live
1 × $6.00 -
×
 Volatile Markets Made Easy: Trading Stocks and Options for Increased Profits with Guy Cohen
1 × $6.00
Volatile Markets Made Easy: Trading Stocks and Options for Increased Profits with Guy Cohen
1 × $6.00 -
×
 Essentials Course & Day Trading Strategies with Bear Bull Traders
1 × $13.00
Essentials Course & Day Trading Strategies with Bear Bull Traders
1 × $13.00 -
×
 60 Seconds Sure Shot Strategy with Albert E
1 × $6.00
60 Seconds Sure Shot Strategy with Albert E
1 × $6.00 -
×
 Starting Out in Futures Trading with Mark Powers
1 × $6.00
Starting Out in Futures Trading with Mark Powers
1 × $6.00 -
×
 Investment Science with David G.Luenberger
1 × $6.00
Investment Science with David G.Luenberger
1 × $6.00 -
×
 Profit Trading VIX Options Course with Don Kaufman
1 × $6.00
Profit Trading VIX Options Course with Don Kaufman
1 × $6.00 -
×
 Handbook for Enviroment Risk Decision Making with C.Richard Cothern
1 × $6.00
Handbook for Enviroment Risk Decision Making with C.Richard Cothern
1 × $6.00 -
×
 Stock Market Strategies That Work with Jack Bernstein
1 × $6.00
Stock Market Strategies That Work with Jack Bernstein
1 × $6.00 -
×
 Asset Prices, Booms & Recessions (2nd Ed.) with Willi Semmler
1 × $6.00
Asset Prices, Booms & Recessions (2nd Ed.) with Willi Semmler
1 × $6.00 -
×
 A Working Man's Forex Position Trading System 2010 with Alan Benefield
1 × $6.00
A Working Man's Forex Position Trading System 2010 with Alan Benefield
1 × $6.00 -
×
 3 Hour Calendar Class With Bonus 3 Months Daily Analysis!
1 × $23.00
3 Hour Calendar Class With Bonus 3 Months Daily Analysis!
1 × $23.00 -
×
 Volume Profile 2023 (Order Flow Pack) with Trader Dale
1 × $5.00
Volume Profile 2023 (Order Flow Pack) with Trader Dale
1 × $5.00 -
×
 4×4 Course with Gregoire Dupont
1 × $6.00
4×4 Course with Gregoire Dupont
1 × $6.00 -
×
 The M21 Strategy
1 × $15.00
The M21 Strategy
1 × $15.00 -
×
 Psychology of the Stock Market (1912) with G.C.Selden
1 × $6.00
Psychology of the Stock Market (1912) with G.C.Selden
1 × $6.00 -
×
 An Introduction to Option Trading Success with James Bittman
1 × $6.00
An Introduction to Option Trading Success with James Bittman
1 × $6.00 -
×
 Quantamentals - The Next Great Forefront Of Trading and Investing with Trading Markets
1 × $8.00
Quantamentals - The Next Great Forefront Of Trading and Investing with Trading Markets
1 × $8.00 -
×
 Day One Trader with John Sussex
1 × $6.00
Day One Trader with John Sussex
1 × $6.00 -
×
 W. D Gann 's Square Of 9 Applied To Modern Markets with Sean Avidar - Hexatrade350
1 × $23.00
W. D Gann 's Square Of 9 Applied To Modern Markets with Sean Avidar - Hexatrade350
1 × $23.00 -
×
 The Crash of 1997 (Article) with Hans Hannula
1 × $6.00
The Crash of 1997 (Article) with Hans Hannula
1 × $6.00 -
×
 Essentials in Quantitative Trading QT01 By HangukQuant's
1 × $23.00
Essentials in Quantitative Trading QT01 By HangukQuant's
1 × $23.00 -
×
 Swing Trading Futures & Commodities with the COT
1 × $93.00
Swing Trading Futures & Commodities with the COT
1 × $93.00 -
×
 The Pocket Mortgage Guide: 60 of the Most Important Questions and Answers About Your Home Loan with Jack Guttentag
1 × $6.00
The Pocket Mortgage Guide: 60 of the Most Important Questions and Answers About Your Home Loan with Jack Guttentag
1 × $6.00 -
×
 Fibonacci Ratios with Pattern Recognition - Larry Pesavento & Steven Shapiro
1 × $6.00
Fibonacci Ratios with Pattern Recognition - Larry Pesavento & Steven Shapiro
1 × $6.00 -
×
 Butterfly and Condor Workshop with Aeromir
1 × $15.00
Butterfly and Condor Workshop with Aeromir
1 × $15.00 -
×
 Stock Market Rules (3rd Ed.) with Michael Sheimo
1 × $6.00
Stock Market Rules (3rd Ed.) with Michael Sheimo
1 × $6.00 -
×
 Deep Dive Butterfly Trading Strategy Class with SJG Trades
1 × $41.00
Deep Dive Butterfly Trading Strategy Class with SJG Trades
1 × $41.00 -
×
 8 Strategies for Day Trading
1 × $31.00
8 Strategies for Day Trading
1 × $31.00 -
×
 Profitable Strategies with Gemify Academy
1 × $10.00
Profitable Strategies with Gemify Academy
1 × $10.00 -
×
 Matrix Spread Options Trading Course with Base Camp Trading
1 × $31.00
Matrix Spread Options Trading Course with Base Camp Trading
1 × $31.00 -
×
 ActiveBeta Indexes. Capturing Systematic Sources of Active Equity Returns (HTML) with Andrew Lo
1 × $6.00
ActiveBeta Indexes. Capturing Systematic Sources of Active Equity Returns (HTML) with Andrew Lo
1 × $6.00 -
×
 Yarimi University Course
1 × $56.00
Yarimi University Course
1 × $56.00 -
×
 Foundational Chart Analysis Series: Support / Resistance Techniques of Professional Traders 6 DVD Home Study Course
1 × $54.00
Foundational Chart Analysis Series: Support / Resistance Techniques of Professional Traders 6 DVD Home Study Course
1 × $54.00 -
×
 How to Build Fortune. Trading Stock Index Futures with Dennis Minogue
1 × $6.00
How to Build Fortune. Trading Stock Index Futures with Dennis Minogue
1 × $6.00 -
×
 NASDAQ Level II Trading Strategies
1 × $6.00
NASDAQ Level II Trading Strategies
1 × $6.00 -
×
 DiNapoli Levels Training Course with Joe DiNapoli & Merrick Okamoto
1 × $6.00
DiNapoli Levels Training Course with Joe DiNapoli & Merrick Okamoto
1 × $6.00 -
×
 Astro Cycles with Larry Pesavento
1 × $6.00
Astro Cycles with Larry Pesavento
1 × $6.00 -
×
 Advanced Breakthroughs in Day Trading DVD course with George Angell
1 × $6.00
Advanced Breakthroughs in Day Trading DVD course with George Angell
1 × $6.00 -
×
 Investing Guide For New Investor with Alfred Scillitani
1 × $6.00
Investing Guide For New Investor with Alfred Scillitani
1 × $6.00 -
×
 High Probability Trading Using Elliott Wave And Fibonacci Analysis withVic Patel - Forex Training Group
1 × $10.00
High Probability Trading Using Elliott Wave And Fibonacci Analysis withVic Patel - Forex Training Group
1 × $10.00 -
×
 SQX Mentorship with Tip Toe Hippo
1 × $23.00
SQX Mentorship with Tip Toe Hippo
1 × $23.00 -
×
 The Complete Guide to Market Breadth Indicators: How to Analyze and Evaluate market Direction and Strength - Greg Morris
1 × $6.00
The Complete Guide to Market Breadth Indicators: How to Analyze and Evaluate market Direction and Strength - Greg Morris
1 × $6.00 -
×
 Forex Trading Advice & Intro to The Natural Flow
1 × $6.00
Forex Trading Advice & Intro to The Natural Flow
1 × $6.00 -
×
 4D Bootcamp with Black Rabbit
1 × $10.00
4D Bootcamp with Black Rabbit
1 × $10.00 -
×
 The Any Hour Trading System with Markets Mastered
1 × $6.00
The Any Hour Trading System with Markets Mastered
1 × $6.00 -
×
 Tech Stock Valuation with Mark Hirschey
1 × $6.00
Tech Stock Valuation with Mark Hirschey
1 × $6.00 -
×
 Master Stock Course
1 × $6.00
Master Stock Course
1 × $6.00 -
×
 Complete Times Course with Afshin Taghechian
1 × $6.00
Complete Times Course with Afshin Taghechian
1 × $6.00 -
×
 Trading Options Effectively with Paul Forchione
1 × $4.00
Trading Options Effectively with Paul Forchione
1 × $4.00 -
×
 Practical Approach to Ninjatrader 8 Platform with Rajandran R
1 × $6.00
Practical Approach to Ninjatrader 8 Platform with Rajandran R
1 × $6.00 -
×
 Star Traders Forex Intermediate Course I with Karen Foo
1 × $8.00
Star Traders Forex Intermediate Course I with Karen Foo
1 × $8.00 -
×
 Daytrade (Italian) with Guiuseppe Migliorino
1 × $6.00
Daytrade (Italian) with Guiuseppe Migliorino
1 × $6.00 -
×
 The Aggressive Conservative Investor with Martin Whitman & Martin Shubik
1 × $6.00
The Aggressive Conservative Investor with Martin Whitman & Martin Shubik
1 × $6.00 -
×
 The Orderflows Trade Opportunities Encyclopedia with Michael Valtos
1 × $8.00
The Orderflows Trade Opportunities Encyclopedia with Michael Valtos
1 × $8.00 -
×
 The Raptor 10 Momentum Methodology Course
1 × $6.00
The Raptor 10 Momentum Methodology Course
1 × $6.00 -
×
 Technical Analysis for Long-Term Investors with Clay Allen
1 × $6.00
Technical Analysis for Long-Term Investors with Clay Allen
1 × $6.00 -
×
 Trading Economic Data System with CopperChips
1 × $6.00
Trading Economic Data System with CopperChips
1 × $6.00 -
×
 NY 6 - Jason McDonald – Why Shorts are Hard to Find and How You Can Find Great Shorts
1 × $6.00
NY 6 - Jason McDonald – Why Shorts are Hard to Find and How You Can Find Great Shorts
1 × $6.00 -
×
 Emini Bonds
1 × $23.00
Emini Bonds
1 × $23.00 -
×
 Fundamentals of Futures & Options Markets (4th Ed.)
1 × $6.00
Fundamentals of Futures & Options Markets (4th Ed.)
1 × $6.00 -
×
 7 Things You MUST Know about Forex Candlesticks
1 × $4.00
7 Things You MUST Know about Forex Candlesticks
1 × $4.00 -
×
 30 Day Masterclass with Joe Elite Trader Hub ICT
1 × $6.00
30 Day Masterclass with Joe Elite Trader Hub ICT
1 × $6.00 -
×
 Core Concepts Mastery with DreamsFX
1 × $5.00
Core Concepts Mastery with DreamsFX
1 × $5.00 -
×
 A Momentum Based Approach to Swing Trading with Dave Landry
1 × $6.00
A Momentum Based Approach to Swing Trading with Dave Landry
1 × $6.00 -
×
 6 (The Proper BackGround)
1 × $6.00
6 (The Proper BackGround)
1 × $6.00 -
×
 Forecasting Profits Using Price & Time with Ed Gately
1 × $6.00
Forecasting Profits Using Price & Time with Ed Gately
1 × $6.00 -
×
 $20 – 52k 20 pips a day challange with Rafał Zuchowicz - TopMasterTrader
1 × $5.00
$20 – 52k 20 pips a day challange with Rafał Zuchowicz - TopMasterTrader
1 × $5.00 -
×
 Four Dimensional Stock Market Structures & Cycles with Bradley Cowan
1 × $6.00
Four Dimensional Stock Market Structures & Cycles with Bradley Cowan
1 × $6.00 -
×
 Formula to a Fortune with Steve Briese, Glen Ring
1 × $6.00
Formula to a Fortune with Steve Briese, Glen Ring
1 × $6.00 -
×
 Fundamentals Trading
1 × $6.00
Fundamentals Trading
1 × $6.00 -
×
 Complete Forex Training Series with 4 x Made Easy
1 × $6.00
Complete Forex Training Series with 4 x Made Easy
1 × $6.00 -
×
 Active Trading Course Notes with Alan Hull
1 × $6.00
Active Trading Course Notes with Alan Hull
1 × $6.00 -
×
 The Orderflow Masterclass with PrimeTrading
1 × $17.00
The Orderflow Masterclass with PrimeTrading
1 × $17.00 -
×
 Measuring Risk in Complex Stochastic Systems with J.Franke, W. Hardle, G. Stahl
1 × $6.00
Measuring Risk in Complex Stochastic Systems with J.Franke, W. Hardle, G. Stahl
1 × $6.00 -
×
 Mastering Candlestick Charts II with Greg Capra
1 × $6.00
Mastering Candlestick Charts II with Greg Capra
1 × $6.00 -
×
 Team Bull Trading Academy
1 × $5.00
Team Bull Trading Academy
1 × $5.00 -
×
 The Best Option Trading Course with David Jaffee - Best Stock Strategy
1 × $15.00
The Best Option Trading Course with David Jaffee - Best Stock Strategy
1 × $15.00 -
×
 Contrarian Investing with Anthony M.Gallea, William Patalon
1 × $6.00
Contrarian Investing with Anthony M.Gallea, William Patalon
1 × $6.00 -
×
 Geometry of Markets I with Bruce Gilmore
1 × $6.00
Geometry of Markets I with Bruce Gilmore
1 × $6.00 -
×
 Capital with Charles D.Ellis
1 × $6.00
Capital with Charles D.Ellis
1 × $6.00 -
×
 The Indices Orderflow Masterclass with The Forex Scalpers
1 × $23.00
The Indices Orderflow Masterclass with The Forex Scalpers
1 × $23.00 -
×
 CAT 2007 Seminar with Stephen W.Bigalow
1 × $6.00
CAT 2007 Seminar with Stephen W.Bigalow
1 × $6.00 -
×
 Forecast 2024 Clarification with Larry Williams
1 × $15.00
Forecast 2024 Clarification with Larry Williams
1 × $15.00 -
×
 Small and Mighty Association with Ryan Lee
1 × $6.00
Small and Mighty Association with Ryan Lee
1 × $6.00 -
×
 Directional Calendars in 2023 with Dan Sheridan & Mark Fenton - Sheridan Options Mentoring
1 × $85.00
Directional Calendars in 2023 with Dan Sheridan & Mark Fenton - Sheridan Options Mentoring
1 × $85.00 -
×
 The Trading Blueprint with Brad Goh - The Trading Geek
1 × $5.00
The Trading Blueprint with Brad Goh - The Trading Geek
1 × $5.00

Reading & Understanding Charts with Andrew Baxter
$6.00
File Size: 311MB
Delivery Time: 1–12 hours
Media Type: Online Course
Content Proof: Watch Here!
You may check content proof of “Reading & Understanding Chartsb with Andrew Baxter” below:

Reading & Understanding Charts with Andrew Baxter
Introduction to Chart Reading
Charts are essential tools for traders, providing visual representations of market data. Andrew Baxter, a renowned trader and educator, shares his expertise on how to read and understand charts effectively. This article will guide you through the basics and advanced techniques of chart reading, helping you make informed trading decisions.
What are Trading Charts?
Definition and Purpose
Trading charts are graphical representations of price movements over time. They help traders analyze trends, identify patterns, and make predictions about future price movements.
Importance of Chart Reading
Understanding charts is crucial for making data-driven decisions in trading. It reduces emotional trading and enhances your ability to spot opportunities and risks.
Types of Trading Charts
1. Line Charts
Line charts are the simplest form of trading charts, showing the closing prices over a period. They provide a clear view of the overall trend but lack detailed information.
2. Bar Charts
Bar charts display the opening, closing, high, and low prices for each period. They offer more information than line charts and help in understanding price volatility.
3. Candlestick Charts
Candlestick charts are popular due to their detailed and visually appealing format. Each candlestick shows the opening, closing, high, and low prices, making it easier to identify market sentiment.
Understanding Candlestick Charts
Components of a Candlestick
- Body: The filled part showing the opening and closing prices.
- Wicks/Shadows: The thin lines representing the high and low prices.
- Color: Indicates whether the closing price was higher (typically green) or lower (typically red) than the opening price.
Common Candlestick Patterns
1. Doji
A Doji occurs when the opening and closing prices are nearly the same, indicating indecision in the market.
2. Hammer
A Hammer has a small body with a long lower wick, suggesting a potential reversal from a downtrend.
3. Engulfing Pattern
An Engulfing pattern occurs when a larger candlestick completely engulfs the previous smaller candlestick, signaling a potential reversal.
Key Chart Patterns
1. Head and Shoulders
This pattern indicates a reversal and is formed by a peak (head) flanked by two smaller peaks (shoulders).
2. Double Top and Double Bottom
These patterns signal a potential reversal. A double top indicates a bearish reversal, while a double bottom suggests a bullish reversal.
3. Triangles
Triangles are continuation patterns that show a period of consolidation before the price continues in the direction of the previous trend.
Using Technical Indicators
1. Moving Averages
Moving averages smooth out price data to identify trends. Common types include Simple Moving Average (SMA) and Exponential Moving Average (EMA).
2. Relative Strength Index (RSI)
RSI measures the speed and change of price movements, indicating overbought or oversold conditions.
3. Moving Average Convergence Divergence (MACD)
MACD shows the relationship between two moving averages, helping to identify potential buy and sell signals.
Combining Chart Patterns and Indicators
Integrated Analysis
Combining chart patterns with technical indicators enhances the reliability of trading signals. For example, confirming a head and shoulders pattern with RSI divergence can provide a stronger signal.
Practical Application
Use a combination of patterns and indicators to develop a comprehensive trading strategy. This approach helps in making more informed and confident trading decisions.
Advanced Chart Reading Techniques
1. Fibonacci Retracement
Fibonacci retracement levels indicate potential support and resistance levels based on the Fibonacci sequence.
2. Volume Analysis
Volume analysis involves examining the number of shares traded to confirm the strength of a price movement or trend.
3. Divergence
Divergence occurs when the price moves in the opposite direction of an indicator, signaling a potential reversal.
Common Mistakes in Chart Reading
1. Overcomplicating Analysis
Avoid using too many indicators and patterns at once. Focus on a few reliable tools to keep your analysis clear and effective.
2. Ignoring Context
Always consider the broader market context and economic factors. Relying solely on charts without context can lead to misleading conclusions.
3. Emotional Trading
Stick to your analysis and avoid making decisions based on emotions. Emotional trading can undermine even the best chart reading skills.
Benefits of Mastering Chart Reading
1. Improved Decision Making
Accurate chart reading helps you make informed decisions, reducing the risk of losses and increasing the potential for gains.
2. Enhanced Trading Strategy
Understanding charts allows you to develop and refine your trading strategies, making them more effective and adaptable.
3. Increased Confidence
With better chart reading skills, you gain confidence in your trading decisions, leading to more consistent performance.
Conclusion
Reading and understanding charts with insights from Andrew Baxter can significantly improve your trading performance. By mastering various chart types, patterns, and technical indicators, you can make more informed decisions and develop robust trading strategies. Embrace these principles, continuously practice, and refine your skills to become a proficient trader.
Frequently Asked Questions:
What are the main types of trading charts?
The main types are line charts, bar charts, and candlestick charts.
Why are candlestick charts popular?
Candlestick charts are popular due to their detailed and visually appealing format, making it easier to identify market sentiment.
What are some common candlestick patterns?
Common patterns include Doji, Hammer, and Engulfing patterns.
How can technical indicators enhance chart reading?
Technical indicators like moving averages, RSI, and MACD help identify trends, momentum, and potential buy/sell signals.
What are some advanced chart reading techniques?
Advanced techniques include Fibonacci retracement, volume analysis, and divergence.
Be the first to review “Reading & Understanding Charts with Andrew Baxter”
You must be logged in to post a review.
Related products
Forex Trading
Original price was: $797.00.$10.00Current price is: $10.00.
Forex Trading
Original price was: $799.00.$15.00Current price is: $15.00.

Original price was: $895.00.$15.00Current price is: $15.00.
Forex Trading
Original price was: $850.00.$23.00Current price is: $23.00.
Original price was: $1,200.00.$23.00Current price is: $23.00.

Original price was: $799.00.$15.00Current price is: $15.00.
Original price was: $299.00.$8.00Current price is: $8.00.
Original price was: $450.00.$23.00Current price is: $23.00.

Original price was: $999.00.$5.00Current price is: $5.00.
Original price was: $497.00.$31.00Current price is: $31.00.

Forex Trading
Original price was: $1,098.00.$39.00Current price is: $39.00.
Forex Trading
Original price was: $697.00.$5.00Current price is: $5.00.

Forex Trading
The Complete Guide to Multiple Time Frame Analysis & Reading Price Action with Aiman Almansoori
Original price was: $1,399.00.$13.00Current price is: $13.00.

Forex Trading
Original price was: $2,995.00.$31.00Current price is: $31.00.

Forex Trading
Original price was: $2,000.00.$23.00Current price is: $23.00.

Forex Trading
Original price was: $500.00.$5.00Current price is: $5.00.

Original price was: $649.00.$20.00Current price is: $20.00.
Original price was: $197.00.$5.00Current price is: $5.00.

Original price was: $4,995.00.$15.00Current price is: $15.00.

Forex Trading
Original price was: $499.00.$15.00Current price is: $15.00.

Reviews
There are no reviews yet.