-
×
 Real Options Analysis: Tools and Techniques for Valuing Strategic Investments and Decisions - Johnathan Mun
1 × $6.00
Real Options Analysis: Tools and Techniques for Valuing Strategic Investments and Decisions - Johnathan Mun
1 × $6.00 -
×
 The 3 Dimensional Trading Breakthrough with Brian Schad
1 × $6.00
The 3 Dimensional Trading Breakthrough with Brian Schad
1 × $6.00 -
×
 BearProof Investing with Kenneth Little
1 × $6.00
BearProof Investing with Kenneth Little
1 × $6.00 -
×
 The Noise Trader Approach to Finance (Article) with Andrei Schleifer, Laurence H.Summers
1 × $6.00
The Noise Trader Approach to Finance (Article) with Andrei Schleifer, Laurence H.Summers
1 × $6.00 -
×
 The Stock Market, Credit & Capital Formation with Fritz Machlup
1 × $6.00
The Stock Market, Credit & Capital Formation with Fritz Machlup
1 × $6.00 -
×
 The Student Guide to Minitab Release 14 with John McKenzie, Robert Goldman
1 × $6.00
The Student Guide to Minitab Release 14 with John McKenzie, Robert Goldman
1 × $6.00 -
×
 Lee Gettess’s Package
1 × $6.00
Lee Gettess’s Package
1 × $6.00 -
×
 The Trap Trade Workshop with Doc Severson
1 × $6.00
The Trap Trade Workshop with Doc Severson
1 × $6.00 -
×
 XLT– Option Trading Course
1 × $6.00
XLT– Option Trading Course
1 × $6.00 -
×
 Raghee Horner's Workspace Bundle + Live Trading By Raghee Horner - Simpler Trading
1 × $23.00
Raghee Horner's Workspace Bundle + Live Trading By Raghee Horner - Simpler Trading
1 × $23.00 -
×
 Robotic Trading: Skill Sharpening with Claytrader
1 × $23.00
Robotic Trading: Skill Sharpening with Claytrader
1 × $23.00 -
×
 Natural Squares Calculator with Lambert-Gann Educators
1 × $6.00
Natural Squares Calculator with Lambert-Gann Educators
1 × $6.00 -
×
 TradingMind Course with Jack Bernstein
1 × $6.00
TradingMind Course with Jack Bernstein
1 × $6.00 -
×
 Markets In Motion with Ned Davis
1 × $6.00
Markets In Motion with Ned Davis
1 × $6.00 -
×
 White Phoenix’s The Smart (Money) Approach to Trading with Jayson Casper
1 × $39.00
White Phoenix’s The Smart (Money) Approach to Trading with Jayson Casper
1 × $39.00 -
×
 Back to the Future – Schabacker’s Principles with Linda Raschke
1 × $6.00
Back to the Future – Schabacker’s Principles with Linda Raschke
1 × $6.00 -
×
 Fractal Markets SFX with Tyson Bieniek
1 × $5.00
Fractal Markets SFX with Tyson Bieniek
1 × $5.00 -
×
 Monthly Newsletter 99-01 with Elliott Wave Theorist
1 × $6.00
Monthly Newsletter 99-01 with Elliott Wave Theorist
1 × $6.00 -
×
 Market Timing & Technical Analysis with Alan Shaw
1 × $6.00
Market Timing & Technical Analysis with Alan Shaw
1 × $6.00 -
×
 Applying Fibonacci Analysis to Price Action
1 × $6.00
Applying Fibonacci Analysis to Price Action
1 × $6.00 -
×
 An Ultimate Guide to Successful Investing with Trading Tuitions
1 × $23.00
An Ultimate Guide to Successful Investing with Trading Tuitions
1 × $23.00 -
×
 Boomer Quick Profits Day Trading Course
1 × $23.00
Boomer Quick Profits Day Trading Course
1 × $23.00 -
×
 Consistently Profitable Trader with Pollinate Trading
1 × $13.00
Consistently Profitable Trader with Pollinate Trading
1 × $13.00 -
×
 Trend Harmony with Murray Ruggiero
1 × $15.00
Trend Harmony with Murray Ruggiero
1 × $15.00 -
×
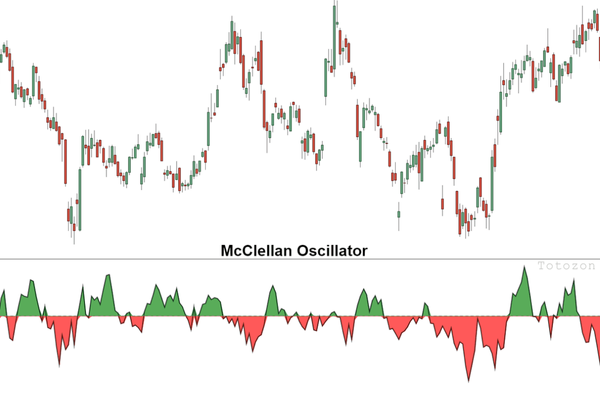 The McClellan Oscillator and Other Tools for with Tom McClellan
1 × $6.00
The McClellan Oscillator and Other Tools for with Tom McClellan
1 × $6.00 -
×
 International Mergers & Acquisitions Activity Since 1990 with Greg Gregoriou & Luc Renneboog
1 × $6.00
International Mergers & Acquisitions Activity Since 1990 with Greg Gregoriou & Luc Renneboog
1 × $6.00 -
×
 Price Action Stock Day Trading Course with Trade That Swing
1 × $62.00
Price Action Stock Day Trading Course with Trade That Swing
1 × $62.00 -
×
 Securities Industry Essentials (SIE) with Brian Lee
1 × $6.00
Securities Industry Essentials (SIE) with Brian Lee
1 × $6.00 -
×
 Trading Psychology with Barry Burns
1 × $4.00
Trading Psychology with Barry Burns
1 × $4.00 -
×
 Day & Position Trading Using DiNapoli Levels with Joe Dinapoli & Merrick Okamoto
1 × $6.00
Day & Position Trading Using DiNapoli Levels with Joe Dinapoli & Merrick Okamoto
1 × $6.00 -
×
 Systems Mastery Course with Chris Dover - Pollinate Trading
1 × $5.00
Systems Mastery Course with Chris Dover - Pollinate Trading
1 × $5.00 -
×
 Fierce 10 with Mandi Rafsendjani
1 × $5.00
Fierce 10 with Mandi Rafsendjani
1 × $5.00 -
×
 Textbook Trading DVD with InvestorsLive
1 × $6.00
Textbook Trading DVD with InvestorsLive
1 × $6.00 -
×
 Art & Science of Trend Trading Class with Jeff Bierman
1 × $6.00
Art & Science of Trend Trading Class with Jeff Bierman
1 × $6.00 -
×
 Flipping Cash Rockstar with Lucas Adamski
1 × $6.00
Flipping Cash Rockstar with Lucas Adamski
1 × $6.00 -
×
 Managing Your Goals with Alec MacKenzie
1 × $6.00
Managing Your Goals with Alec MacKenzie
1 × $6.00 -
×
 Finding Top Secret Statagies with AlphaShark Trading
1 × $109.00
Finding Top Secret Statagies with AlphaShark Trading
1 × $109.00 -
×
 Traders Business Plan with Adrienne Laris Toghraie
1 × $6.00
Traders Business Plan with Adrienne Laris Toghraie
1 × $6.00 -
×
 Full Volume Forex Training Course with ThatFXTrader
1 × $5.00
Full Volume Forex Training Course with ThatFXTrader
1 × $5.00 -
×
 AutoTrader-Fully Automated Trading System with Trading123
1 × $46.00
AutoTrader-Fully Automated Trading System with Trading123
1 × $46.00 -
×
 USDX Trading Course with Jared Martinez - MTI
1 × $6.00
USDX Trading Course with Jared Martinez - MTI
1 × $6.00 -
×
 The Market Masters: Wall Street's Top Investment Pros Reveal How to Make Money in Both Bull and Bear Markets - Kirk Kazanjian
1 × $6.00
The Market Masters: Wall Street's Top Investment Pros Reveal How to Make Money in Both Bull and Bear Markets - Kirk Kazanjian
1 × $6.00 -
×
 The Profit Magic of Stock Transaction Timing with J.M.Hurst
1 × $6.00
The Profit Magic of Stock Transaction Timing with J.M.Hurst
1 × $6.00 -
×
 Forex Millionaire Course with Willis University
1 × $6.00
Forex Millionaire Course with Willis University
1 × $6.00 -
×
 Startup Trading Masterclass with Jack Gleason
1 × $93.00
Startup Trading Masterclass with Jack Gleason
1 × $93.00 -
×
 Advanced AmiBroker Coding with Matt Radtke & Connors Research
1 × $23.00
Advanced AmiBroker Coding with Matt Radtke & Connors Research
1 × $23.00 -
×
 Beyond Fibonacci Retracements with Dynamic Traders
1 × $5.00
Beyond Fibonacci Retracements with Dynamic Traders
1 × $5.00 -
×
 Investing for the Long Term with Peter Bernstein
1 × $6.00
Investing for the Long Term with Peter Bernstein
1 × $6.00 -
×
 Compass Trading System with Right Line Trading
1 × $39.00
Compass Trading System with Right Line Trading
1 × $39.00 -
×
 Fibonacci – CCI Workshop Recording Series (2006 & 2008)
1 × $6.00
Fibonacci – CCI Workshop Recording Series (2006 & 2008)
1 × $6.00 -
×
 The MMXM Traders Course - The MMXM Trader
1 × $5.00
The MMXM Traders Course - The MMXM Trader
1 × $5.00 -
×
 AI For Traders with Trading Markets
1 × $31.00
AI For Traders with Trading Markets
1 × $31.00 -
×
 Sun Tzu and the Art of War for Traders with Dean Lundell
1 × $6.00
Sun Tzu and the Art of War for Traders with Dean Lundell
1 × $6.00 -
×
 Price Action Manual (2nd Ed.) with Bruce Gilmore
1 × $6.00
Price Action Manual (2nd Ed.) with Bruce Gilmore
1 × $6.00 -
×
 Asset Markets, Portfolio Choice and Macroeconomic Activity: A Keynesian Perspective - Toichiro Asadra, Peter Flaschel, Tarik Mouakil & Christian Proaño
1 × $6.00
Asset Markets, Portfolio Choice and Macroeconomic Activity: A Keynesian Perspective - Toichiro Asadra, Peter Flaschel, Tarik Mouakil & Christian Proaño
1 × $6.00 -
×
 Ichimokutrade - Elliot Wave 101
1 × $15.00
Ichimokutrade - Elliot Wave 101
1 × $15.00 -
×
 Essentials Course & Day Trading Strategies with Bear Bull Traders
1 × $13.00
Essentials Course & Day Trading Strategies with Bear Bull Traders
1 × $13.00 -
×
 Learn To Trade Markets with Karl Richards
1 × $6.00
Learn To Trade Markets with Karl Richards
1 × $6.00 -
×
 BWT Precision 7.0.2.3 (bluewavetrading.com)
1 × $31.00
BWT Precision 7.0.2.3 (bluewavetrading.com)
1 × $31.00 -
×
 Successful Stock Speculation (1922) with John James
1 × $6.00
Successful Stock Speculation (1922) with John James
1 × $6.00 -
×
 Preparing for the Worst: Incorporating Downside Risk in Stock Market Investments with Hrishikesh Vinod & Derrick Reagle
1 × $6.00
Preparing for the Worst: Incorporating Downside Risk in Stock Market Investments with Hrishikesh Vinod & Derrick Reagle
1 × $6.00 -
×
 Investing Online with Benton E.Gup
1 × $6.00
Investing Online with Benton E.Gup
1 × $6.00 -
×
 Creating & Using a Trading Plan with Paul Lange
1 × $8.00
Creating & Using a Trading Plan with Paul Lange
1 × $8.00 -
×
 Elliott Flat Waves CD with David Elliott
1 × $6.00
Elliott Flat Waves CD with David Elliott
1 × $6.00 -
×
 Complete Series
1 × $31.00
Complete Series
1 × $31.00 -
×
 SQX Mentorship with Tip Toe Hippo
1 × $23.00
SQX Mentorship with Tip Toe Hippo
1 × $23.00

Reading & Understanding Charts with Andrew Baxter
$6.00
File Size: 311MB
Delivery Time: 1–12 hours
Media Type: Online Course
Content Proof: Watch Here!
You may check content proof of “Reading & Understanding Chartsb with Andrew Baxter” below:

Reading & Understanding Charts with Andrew Baxter
Introduction to Chart Reading
Charts are essential tools for traders, providing visual representations of market data. Andrew Baxter, a renowned trader and educator, shares his expertise on how to read and understand charts effectively. This article will guide you through the basics and advanced techniques of chart reading, helping you make informed trading decisions.
What are Trading Charts?
Definition and Purpose
Trading charts are graphical representations of price movements over time. They help traders analyze trends, identify patterns, and make predictions about future price movements.
Importance of Chart Reading
Understanding charts is crucial for making data-driven decisions in trading. It reduces emotional trading and enhances your ability to spot opportunities and risks.
Types of Trading Charts
1. Line Charts
Line charts are the simplest form of trading charts, showing the closing prices over a period. They provide a clear view of the overall trend but lack detailed information.
2. Bar Charts
Bar charts display the opening, closing, high, and low prices for each period. They offer more information than line charts and help in understanding price volatility.
3. Candlestick Charts
Candlestick charts are popular due to their detailed and visually appealing format. Each candlestick shows the opening, closing, high, and low prices, making it easier to identify market sentiment.
Understanding Candlestick Charts
Components of a Candlestick
- Body: The filled part showing the opening and closing prices.
- Wicks/Shadows: The thin lines representing the high and low prices.
- Color: Indicates whether the closing price was higher (typically green) or lower (typically red) than the opening price.
Common Candlestick Patterns
1. Doji
A Doji occurs when the opening and closing prices are nearly the same, indicating indecision in the market.
2. Hammer
A Hammer has a small body with a long lower wick, suggesting a potential reversal from a downtrend.
3. Engulfing Pattern
An Engulfing pattern occurs when a larger candlestick completely engulfs the previous smaller candlestick, signaling a potential reversal.
Key Chart Patterns
1. Head and Shoulders
This pattern indicates a reversal and is formed by a peak (head) flanked by two smaller peaks (shoulders).
2. Double Top and Double Bottom
These patterns signal a potential reversal. A double top indicates a bearish reversal, while a double bottom suggests a bullish reversal.
3. Triangles
Triangles are continuation patterns that show a period of consolidation before the price continues in the direction of the previous trend.
Using Technical Indicators
1. Moving Averages
Moving averages smooth out price data to identify trends. Common types include Simple Moving Average (SMA) and Exponential Moving Average (EMA).
2. Relative Strength Index (RSI)
RSI measures the speed and change of price movements, indicating overbought or oversold conditions.
3. Moving Average Convergence Divergence (MACD)
MACD shows the relationship between two moving averages, helping to identify potential buy and sell signals.
Combining Chart Patterns and Indicators
Integrated Analysis
Combining chart patterns with technical indicators enhances the reliability of trading signals. For example, confirming a head and shoulders pattern with RSI divergence can provide a stronger signal.
Practical Application
Use a combination of patterns and indicators to develop a comprehensive trading strategy. This approach helps in making more informed and confident trading decisions.
Advanced Chart Reading Techniques
1. Fibonacci Retracement
Fibonacci retracement levels indicate potential support and resistance levels based on the Fibonacci sequence.
2. Volume Analysis
Volume analysis involves examining the number of shares traded to confirm the strength of a price movement or trend.
3. Divergence
Divergence occurs when the price moves in the opposite direction of an indicator, signaling a potential reversal.
Common Mistakes in Chart Reading
1. Overcomplicating Analysis
Avoid using too many indicators and patterns at once. Focus on a few reliable tools to keep your analysis clear and effective.
2. Ignoring Context
Always consider the broader market context and economic factors. Relying solely on charts without context can lead to misleading conclusions.
3. Emotional Trading
Stick to your analysis and avoid making decisions based on emotions. Emotional trading can undermine even the best chart reading skills.
Benefits of Mastering Chart Reading
1. Improved Decision Making
Accurate chart reading helps you make informed decisions, reducing the risk of losses and increasing the potential for gains.
2. Enhanced Trading Strategy
Understanding charts allows you to develop and refine your trading strategies, making them more effective and adaptable.
3. Increased Confidence
With better chart reading skills, you gain confidence in your trading decisions, leading to more consistent performance.
Conclusion
Reading and understanding charts with insights from Andrew Baxter can significantly improve your trading performance. By mastering various chart types, patterns, and technical indicators, you can make more informed decisions and develop robust trading strategies. Embrace these principles, continuously practice, and refine your skills to become a proficient trader.
Frequently Asked Questions:
What are the main types of trading charts?
The main types are line charts, bar charts, and candlestick charts.
Why are candlestick charts popular?
Candlestick charts are popular due to their detailed and visually appealing format, making it easier to identify market sentiment.
What are some common candlestick patterns?
Common patterns include Doji, Hammer, and Engulfing patterns.
How can technical indicators enhance chart reading?
Technical indicators like moving averages, RSI, and MACD help identify trends, momentum, and potential buy/sell signals.
What are some advanced chart reading techniques?
Advanced techniques include Fibonacci retracement, volume analysis, and divergence.
Be the first to review “Reading & Understanding Charts with Andrew Baxter”
You must be logged in to post a review.
Related products

Original price was: $299.00.$8.00Current price is: $8.00.

Forex Trading
Original price was: $249.00.$15.00Current price is: $15.00.

Forex Trading
Original price was: $799.00.$15.00Current price is: $15.00.

Original price was: $2,120.00.$15.00Current price is: $15.00.
Original price was: $700.00.$39.00Current price is: $39.00.

Forex Trading
Original price was: $499.00.$15.00Current price is: $15.00.

Original price was: $695.00.$41.00Current price is: $41.00.

Original price was: $497.00.$31.00Current price is: $31.00.

Original price was: $1,849.00.$15.00Current price is: $15.00.

Original price was: $310.00.$23.00Current price is: $23.00.

Forex Trading
Original price was: $4,997.00.$27.00Current price is: $27.00.
Forex Trading
Original price was: $1,898.00.$10.00Current price is: $10.00.

Original price was: $497.00.$11.00Current price is: $11.00.

Original price was: $1,200.00.$23.00Current price is: $23.00.
Forex Trading
Original price was: $1,098.00.$39.00Current price is: $39.00.

Forex Trading
Original price was: $550.00.$5.00Current price is: $5.00.

Original price was: $997.00.$8.00Current price is: $8.00.

Original price was: $450.00.$23.00Current price is: $23.00.

Forex Trading
Original price was: $797.00.$10.00Current price is: $10.00.

Forex Trading
Original price was: $999.00.$15.00Current price is: $15.00.

Reviews
There are no reviews yet.