-
×
 The Naked Eye: Raw Data Analytics with Edgar Torres - Raw Data Analytics
1 × $8.00
The Naked Eye: Raw Data Analytics with Edgar Torres - Raw Data Analytics
1 × $8.00 -
×
 The Orderflows Trade Opportunities Encyclopedia with Michael Valtos
1 × $8.00
The Orderflows Trade Opportunities Encyclopedia with Michael Valtos
1 × $8.00 -
×
 Home Run Options Trading Course with Dave Aquino - Base Camp Trading
1 × $11.00
Home Run Options Trading Course with Dave Aquino - Base Camp Trading
1 × $11.00 -
×
 The A14 Weekly Option Strategy Workshop with Amy Meissner
1 × $23.00
The A14 Weekly Option Strategy Workshop with Amy Meissner
1 × $23.00 -
×
 ICT Prodigy Trading Course – $650K in Payouts with Alex Solignani
1 × $15.00
ICT Prodigy Trading Course – $650K in Payouts with Alex Solignani
1 × $15.00 -
×
 REMORA OPTIONS TRADING (Silver Membership)
1 × $23.00
REMORA OPTIONS TRADING (Silver Membership)
1 × $23.00 -
×
 TRADING NFX Course with Andrew NFX
1 × $5.00
TRADING NFX Course with Andrew NFX
1 × $5.00 -
×
 0 DTE Options Trading Workshop with Aeromir Corporation
1 × $15.00
0 DTE Options Trading Workshop with Aeromir Corporation
1 × $15.00 -
×
 Deep Dive Butterfly Trading Strategy Class with SJG Trades
1 × $41.00
Deep Dive Butterfly Trading Strategy Class with SJG Trades
1 × $41.00 -
×
 Butterfly and Condor Workshop with Aeromir
1 × $15.00
Butterfly and Condor Workshop with Aeromir
1 × $15.00 -
×
 WondaFX Signature Strategy with WondaFX
1 × $5.00
WondaFX Signature Strategy with WondaFX
1 × $5.00 -
×
 Advanced Spread Trading with Guy Bower - MasterClass Trader
1 × $15.00
Advanced Spread Trading with Guy Bower - MasterClass Trader
1 × $15.00 -
×
![The Art of Trading Covered Writes [1 video (AVI)] image](https://www.totozon.com/wp-content/uploads/2024/07/A-trader-analyzing-earnings-reports-on-a-computer-screen.png) Learn To Trade Earnings with Dan Sheridan
1 × $23.00
Learn To Trade Earnings with Dan Sheridan
1 × $23.00 -
×
 Bond Market Course with The Macro Compass
1 × $15.00
Bond Market Course with The Macro Compass
1 × $15.00 -
×
 Options Trading & Ultimate MasterClass With Tyrone Abela - FX Evolution
1 × $54.00
Options Trading & Ultimate MasterClass With Tyrone Abela - FX Evolution
1 × $54.00 -
×
 Stock Patterns for DayTrading I & II with Barry Rudd
1 × $6.00
Stock Patterns for DayTrading I & II with Barry Rudd
1 × $6.00 -
×
 Crypto Trading Academy with Cheeky Investor - Aussie Day Trader
1 × $13.00
Crypto Trading Academy with Cheeky Investor - Aussie Day Trader
1 × $13.00 -
×
 How To Read The Market Professionally with TradeSmart
1 × $27.00
How To Read The Market Professionally with TradeSmart
1 × $27.00 -
×
 AI For Traders with Trading Markets
1 × $31.00
AI For Traders with Trading Markets
1 × $31.00 -
×
 Best of the Best: Collars with Amy Meissner & Scott Ruble
1 × $15.00
Best of the Best: Collars with Amy Meissner & Scott Ruble
1 × $15.00 -
×
 Advanced Fibonacci Course with Major League Trading
1 × $23.00
Advanced Fibonacci Course with Major League Trading
1 × $23.00 -
×
 Ultimate Trading Course with Dodgy's Dungeon
1 × $8.00
Ultimate Trading Course with Dodgy's Dungeon
1 × $8.00 -
×
 Trading Short TermSame Day Trades Sep 2023 with Dan Sheridan & Mark Fenton - Sheridan Options Mentoring
1 × $31.00
Trading Short TermSame Day Trades Sep 2023 with Dan Sheridan & Mark Fenton - Sheridan Options Mentoring
1 × $31.00 -
×
 FMG Online Course with FMG Traders
1 × $6.00
FMG Online Course with FMG Traders
1 × $6.00 -
×
 Adz Trading Academy
1 × $5.00
Adz Trading Academy
1 × $5.00 -
×
 The Prop Trading Code with Brannigan Barrett - Axia Futures
1 × $23.00
The Prop Trading Code with Brannigan Barrett - Axia Futures
1 × $23.00 -
×
 Crystal Ball Pack PLUS bonus Live Trade By Pat Mitchell - Trick Trades
1 × $20.00
Crystal Ball Pack PLUS bonus Live Trade By Pat Mitchell - Trick Trades
1 × $20.00 -
×
 SQX Mentorship with Tip Toe Hippo
1 × $23.00
SQX Mentorship with Tip Toe Hippo
1 × $23.00 -
×
 TradeCraft: Your Path to Peak Performance Trading By Adam Grimes
1 × $15.00
TradeCraft: Your Path to Peak Performance Trading By Adam Grimes
1 × $15.00 -
×
 Quantamentals - The Next Great Forefront Of Trading and Investing with Trading Markets
1 × $8.00
Quantamentals - The Next Great Forefront Of Trading and Investing with Trading Markets
1 × $8.00 -
×
 Order flow self-study training program with iMFtracker
1 × $10.00
Order flow self-study training program with iMFtracker
1 × $10.00 -
×
 We Trade Waves
1 × $5.00
We Trade Waves
1 × $5.00 -
×
 Scalp Strategy and Flipping Small Accounts with Opes Trading Group
1 × $5.00
Scalp Strategy and Flipping Small Accounts with Opes Trading Group
1 × $5.00 -
×
 Graphs, Application to Speculation with George Cole
1 × $6.00
Graphs, Application to Speculation with George Cole
1 × $6.00 -
×
 Compass Trading System with Right Line Trading
1 × $39.00
Compass Trading System with Right Line Trading
1 × $39.00 -
×
 W. D Gann 's Square Of 9 Applied To Modern Markets with Sean Avidar - Hexatrade350
1 × $23.00
W. D Gann 's Square Of 9 Applied To Modern Markets with Sean Avidar - Hexatrade350
1 × $23.00 -
×
 Matrix Spread Options Trading Course with Base Camp Trading
1 × $31.00
Matrix Spread Options Trading Course with Base Camp Trading
1 × $31.00 -
×
 The Orderflow Masterclass with PrimeTrading
1 × $17.00
The Orderflow Masterclass with PrimeTrading
1 × $17.00 -
×
 Start Trading Stocks Using Technical Analysis Part 2 with Corey Halliday
1 × $15.00
Start Trading Stocks Using Technical Analysis Part 2 with Corey Halliday
1 × $15.00 -
×
 The Investor Accelerator Premium Membership
1 × $34.00
The Investor Accelerator Premium Membership
1 × $34.00 -
×
 Learn Plan Profit – How To Trade Stocks
1 × $15.00
Learn Plan Profit – How To Trade Stocks
1 × $15.00 -
×
 The Indices Orderflow Masterclass with The Forex Scalpers
1 × $23.00
The Indices Orderflow Masterclass with The Forex Scalpers
1 × $23.00 -
×
 The Complete Guide to Multiple Time Frame Analysis & Reading Price Action with Aiman Almansoori
1 × $13.00
The Complete Guide to Multiple Time Frame Analysis & Reading Price Action with Aiman Almansoori
1 × $13.00 -
×
 International Mergers & Acquisitions Activity Since 1990 with Greg Gregoriou & Luc Renneboog
1 × $6.00
International Mergers & Acquisitions Activity Since 1990 with Greg Gregoriou & Luc Renneboog
1 × $6.00 -
×
 Level 1 - Japanese Candlesticks Trading Mastery Program with Rohit Musale & Rashmi Musale
1 × $5.00
Level 1 - Japanese Candlesticks Trading Mastery Program with Rohit Musale & Rashmi Musale
1 × $5.00 -
×
 White Phoenix’s The Smart (Money) Approach to Trading with Jayson Casper
1 × $39.00
White Phoenix’s The Smart (Money) Approach to Trading with Jayson Casper
1 × $39.00 -
×
 Dow Theory Redux with Michael Sheimo
1 × $6.00
Dow Theory Redux with Michael Sheimo
1 × $6.00 -
×
 The Trading Blueprint with Brad Goh - The Trading Geek
1 × $5.00
The Trading Blueprint with Brad Goh - The Trading Geek
1 × $5.00 -
×
 Power Charting - Robert’s Indicator Webinar
1 × $6.00
Power Charting - Robert’s Indicator Webinar
1 × $6.00 -
×
 Optionetics Trading Strategies
1 × $5.00
Optionetics Trading Strategies
1 × $5.00 -
×
 The Banks Code with Smart Money Trader
1 × $34.00
The Banks Code with Smart Money Trader
1 × $34.00 -
×
 Real Options in Practice with Marion A.Brach
1 × $6.00
Real Options in Practice with Marion A.Brach
1 × $6.00 -
×
 Level II Profit System with Sammy Chua
1 × $6.00
Level II Profit System with Sammy Chua
1 × $6.00 -
×
 The 1% Club with Trader Mike
1 × $5.00
The 1% Club with Trader Mike
1 × $5.00 -
×
 Forex Trading Systems Elearning Course - Busted Breakout System with Van Tharp
1 × $6.00
Forex Trading Systems Elearning Course - Busted Breakout System with Van Tharp
1 × $6.00 -
×
 Essentials in Quantitative Trading QT01 By HangukQuant's
1 × $23.00
Essentials in Quantitative Trading QT01 By HangukQuant's
1 × $23.00 -
×
 Complete Gunner24 Trading & Forecasting Course
1 × $6.00
Complete Gunner24 Trading & Forecasting Course
1 × $6.00 -
×
 $20 – 52k 20 pips a day challange with Rafał Zuchowicz - TopMasterTrader
1 × $5.00
$20 – 52k 20 pips a day challange with Rafał Zuchowicz - TopMasterTrader
1 × $5.00 -
×
 The Best Option Trading Course with David Jaffee - Best Stock Strategy
1 × $15.00
The Best Option Trading Course with David Jaffee - Best Stock Strategy
1 × $15.00 -
×
 New York Super Conference 2016 Videos
1 × $31.00
New York Super Conference 2016 Videos
1 × $31.00 -
×
 The Stock Market Trading Secrets of the Late (1940, scaned)
1 × $6.00
The Stock Market Trading Secrets of the Late (1940, scaned)
1 × $6.00 -
×
 The Management of Equity Investments with Dimitris Chorafas
1 × $6.00
The Management of Equity Investments with Dimitris Chorafas
1 × $6.00 -
×
 The Cash Flow Bootcamp with John Macgregor
1 × $233.00
The Cash Flow Bootcamp with John Macgregor
1 × $233.00 -
×
 High Probability Trading Using Elliott Wave And Fibonacci Analysis withVic Patel - Forex Training Group
1 × $10.00
High Probability Trading Using Elliott Wave And Fibonacci Analysis withVic Patel - Forex Training Group
1 × $10.00 -
×
 Adaptation in Sports Training (1995) with Atko Viru
1 × $23.00
Adaptation in Sports Training (1995) with Atko Viru
1 × $23.00 -
×
 John Carter SimplerOptions John Trade TSLA Live on TOS Making 1.5 Million Dollars 2014-01-15
1 × $6.00
John Carter SimplerOptions John Trade TSLA Live on TOS Making 1.5 Million Dollars 2014-01-15
1 × $6.00 -
×
 Forecast 2024 Clarification with Larry Williams
1 × $15.00
Forecast 2024 Clarification with Larry Williams
1 × $15.00 -
×
 Price Analysis Webinar with Carolyn Boroden
1 × $6.00
Price Analysis Webinar with Carolyn Boroden
1 × $6.00 -
×
 The GBP USD Trading System with A.Heuscher
1 × $6.00
The GBP USD Trading System with A.Heuscher
1 × $6.00 -
×
 Futures Broker Home Study Course CTA Series 3 (Fourteenth Ed.) with Center for Futures Education
1 × $6.00
Futures Broker Home Study Course CTA Series 3 (Fourteenth Ed.) with Center for Futures Education
1 × $6.00 -
×
 Algo Trading Masterclass with Ali Casey - StatOasis
1 × $23.00
Algo Trading Masterclass with Ali Casey - StatOasis
1 × $23.00 -
×
 Quality FX Academy
1 × $5.00
Quality FX Academy
1 × $5.00 -
×
 Euro Fractal Trading System with Cynthia Marcy, Erol Bortucene
1 × $6.00
Euro Fractal Trading System with Cynthia Marcy, Erol Bortucene
1 × $6.00 -
×
 John Bollinger on Bollinger Bands
1 × $6.00
John Bollinger on Bollinger Bands
1 × $6.00 -
×
 FX Capital Online
1 × $5.00
FX Capital Online
1 × $5.00 -
×
 Maximum Lots Trading Course with Joe Wright
1 × $34.00
Maximum Lots Trading Course with Joe Wright
1 × $34.00 -
×
 Reedstrader 101: Mechanical Trading Strategy Workshop - REEDSTRADER
1 × $31.00
Reedstrader 101: Mechanical Trading Strategy Workshop - REEDSTRADER
1 × $31.00 -
×
 Outsmarting the Smart Money with Lawrence A.Cunningham
1 × $6.00
Outsmarting the Smart Money with Lawrence A.Cunningham
1 × $6.00 -
×
 The Complete Options Trading Course (New 2019) with Wealthy Education
1 × $6.00
The Complete Options Trading Course (New 2019) with Wealthy Education
1 × $6.00 -
×
 Longlived Information & Intraday Pattern (Article) with Back and Andersen
1 × $6.00
Longlived Information & Intraday Pattern (Article) with Back and Andersen
1 × $6.00 -
×
 Derivate Instruments by Brian A.Eales
1 × $6.00
Derivate Instruments by Brian A.Eales
1 × $6.00 -
×
 Surplus Trader Secrets Masterclass Coaching Program
1 × $6.00
Surplus Trader Secrets Masterclass Coaching Program
1 × $6.00

Reading & Understanding Charts with Andrew Baxter
$6.00
File Size: 311MB
Delivery Time: 1–12 hours
Media Type: Online Course
Content Proof: Watch Here!
You may check content proof of “Reading & Understanding Chartsb with Andrew Baxter” below:

Reading & Understanding Charts with Andrew Baxter
Introduction to Chart Reading
Charts are essential tools for traders, providing visual representations of market data. Andrew Baxter, a renowned trader and educator, shares his expertise on how to read and understand charts effectively. This article will guide you through the basics and advanced techniques of chart reading, helping you make informed trading decisions.
What are Trading Charts?
Definition and Purpose
Trading charts are graphical representations of price movements over time. They help traders analyze trends, identify patterns, and make predictions about future price movements.
Importance of Chart Reading
Understanding charts is crucial for making data-driven decisions in trading. It reduces emotional trading and enhances your ability to spot opportunities and risks.
Types of Trading Charts
1. Line Charts
Line charts are the simplest form of trading charts, showing the closing prices over a period. They provide a clear view of the overall trend but lack detailed information.
2. Bar Charts
Bar charts display the opening, closing, high, and low prices for each period. They offer more information than line charts and help in understanding price volatility.
3. Candlestick Charts
Candlestick charts are popular due to their detailed and visually appealing format. Each candlestick shows the opening, closing, high, and low prices, making it easier to identify market sentiment.
Understanding Candlestick Charts
Components of a Candlestick
- Body: The filled part showing the opening and closing prices.
- Wicks/Shadows: The thin lines representing the high and low prices.
- Color: Indicates whether the closing price was higher (typically green) or lower (typically red) than the opening price.
Common Candlestick Patterns
1. Doji
A Doji occurs when the opening and closing prices are nearly the same, indicating indecision in the market.
2. Hammer
A Hammer has a small body with a long lower wick, suggesting a potential reversal from a downtrend.
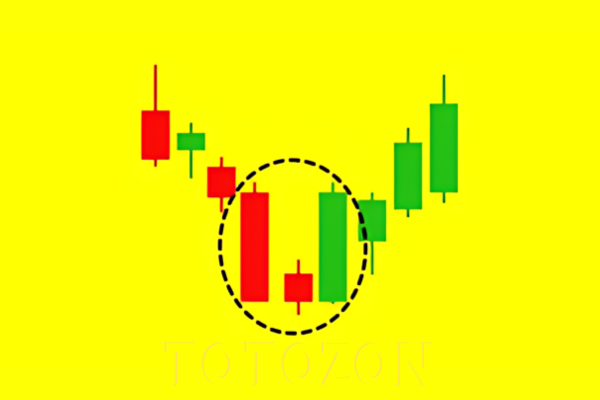
3. Engulfing Pattern
An Engulfing pattern occurs when a larger candlestick completely engulfs the previous smaller candlestick, signaling a potential reversal.
Key Chart Patterns
1. Head and Shoulders
This pattern indicates a reversal and is formed by a peak (head) flanked by two smaller peaks (shoulders).
2. Double Top and Double Bottom
These patterns signal a potential reversal. A double top indicates a bearish reversal, while a double bottom suggests a bullish reversal.
3. Triangles
Triangles are continuation patterns that show a period of consolidation before the price continues in the direction of the previous trend.
Using Technical Indicators
1. Moving Averages
Moving averages smooth out price data to identify trends. Common types include Simple Moving Average (SMA) and Exponential Moving Average (EMA).
2. Relative Strength Index (RSI)
RSI measures the speed and change of price movements, indicating overbought or oversold conditions.
3. Moving Average Convergence Divergence (MACD)
MACD shows the relationship between two moving averages, helping to identify potential buy and sell signals.
Combining Chart Patterns and Indicators
Integrated Analysis
Combining chart patterns with technical indicators enhances the reliability of trading signals. For example, confirming a head and shoulders pattern with RSI divergence can provide a stronger signal.
Practical Application
Use a combination of patterns and indicators to develop a comprehensive trading strategy. This approach helps in making more informed and confident trading decisions.
Advanced Chart Reading Techniques
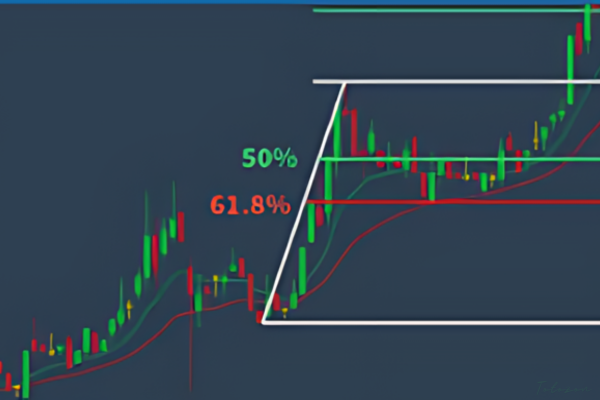
1. Fibonacci Retracement
Fibonacci retracement levels indicate potential support and resistance levels based on the Fibonacci sequence.
2. Volume Analysis
Volume analysis involves examining the number of shares traded to confirm the strength of a price movement or trend.
3. Divergence
Divergence occurs when the price moves in the opposite direction of an indicator, signaling a potential reversal.
Common Mistakes in Chart Reading
1. Overcomplicating Analysis
Avoid using too many indicators and patterns at once. Focus on a few reliable tools to keep your analysis clear and effective.
2. Ignoring Context
Always consider the broader market context and economic factors. Relying solely on charts without context can lead to misleading conclusions.
3. Emotional Trading
Stick to your analysis and avoid making decisions based on emotions. Emotional trading can undermine even the best chart reading skills.
Benefits of Mastering Chart Reading
1. Improved Decision Making
Accurate chart reading helps you make informed decisions, reducing the risk of losses and increasing the potential for gains.
2. Enhanced Trading Strategy
Understanding charts allows you to develop and refine your trading strategies, making them more effective and adaptable.
3. Increased Confidence
With better chart reading skills, you gain confidence in your trading decisions, leading to more consistent performance.
Conclusion
Reading and understanding charts with insights from Andrew Baxter can significantly improve your trading performance. By mastering various chart types, patterns, and technical indicators, you can make more informed decisions and develop robust trading strategies. Embrace these principles, continuously practice, and refine your skills to become a proficient trader.
Frequently Asked Questions:
What are the main types of trading charts?
The main types are line charts, bar charts, and candlestick charts.
Why are candlestick charts popular?
Candlestick charts are popular due to their detailed and visually appealing format, making it easier to identify market sentiment.
What are some common candlestick patterns?
Common patterns include Doji, Hammer, and Engulfing patterns.
How can technical indicators enhance chart reading?
Technical indicators like moving averages, RSI, and MACD help identify trends, momentum, and potential buy/sell signals.
What are some advanced chart reading techniques?
Advanced techniques include Fibonacci retracement, volume analysis, and divergence.
Be the first to review “Reading & Understanding Charts with Andrew Baxter”
You must be logged in to post a review.
Related products
Forex Trading
Original price was: $799.00.$15.00Current price is: $15.00.
Original price was: $1,200.00.$23.00Current price is: $23.00.
Forex Trading
Original price was: $797.00.$10.00Current price is: $10.00.
Forex Trading
Original price was: $1,098.00.$39.00Current price is: $39.00.
Original price was: $497.00.$31.00Current price is: $31.00.
Original price was: $799.00.$15.00Current price is: $15.00.
Forex Trading
Original price was: $239.00.$8.00Current price is: $8.00.
Forex Trading
Original price was: $697.00.$5.00Current price is: $5.00.
Forex Trading
Original price was: $1,898.00.$10.00Current price is: $10.00.
Original price was: $999.00.$5.00Current price is: $5.00.
Original price was: $700.00.$39.00Current price is: $39.00.
Forex Trading
Original price was: $2,997.00.$23.00Current price is: $23.00.
Original price was: $197.00.$5.00Current price is: $5.00.
Original price was: $497.00.$11.00Current price is: $11.00.
Forex Trading
Original price was: $850.00.$23.00Current price is: $23.00.
Original price was: $139.00.$23.00Current price is: $23.00.
Forex Trading
Original price was: $397.00.$31.00Current price is: $31.00.
Original price was: $1,849.00.$15.00Current price is: $15.00.
Original price was: $997.00.$13.00Current price is: $13.00.
Forex Trading
Original price was: $999.00.$15.00Current price is: $15.00.

Reviews
There are no reviews yet.