-
×
 The Vol.T Volume-Tick Indicator Package
1 × $23.00
The Vol.T Volume-Tick Indicator Package
1 × $23.00 -
×
 Trading High-Momentum Stocks with Landry Persistent Pullbacks
1 × $15.00
Trading High-Momentum Stocks with Landry Persistent Pullbacks
1 × $15.00 -
×
 Forex Profit Multiplier with Bill & Greg Poulos
1 × $6.00
Forex Profit Multiplier with Bill & Greg Poulos
1 × $6.00 -
×
 Algo Trading Strategies 2017 with Autotrading Academy
1 × $6.00
Algo Trading Strategies 2017 with Autotrading Academy
1 × $6.00 -
×
 Scalping is Fun Course with Peter Devaere
1 × $109.00
Scalping is Fun Course with Peter Devaere
1 × $109.00 -
×
 Order flow self-study training program with iMFtracker
1 × $10.00
Order flow self-study training program with iMFtracker
1 × $10.00 -
×
 Swing Trading for a Living (7 Video Cds & WorkBook 2.1 GB)
1 × $6.00
Swing Trading for a Living (7 Video Cds & WorkBook 2.1 GB)
1 × $6.00 -
×
 Trade Like Warren Buffett with James Altucher
1 × $6.00
Trade Like Warren Buffett with James Altucher
1 × $6.00 -
×
 Ez-Forex Trading System 4.2 with Beau Diamond
1 × $6.00
Ez-Forex Trading System 4.2 with Beau Diamond
1 × $6.00 -
×
 Stochastic Calculus with Alan Bain
1 × $6.00
Stochastic Calculus with Alan Bain
1 × $6.00 -
×
 6 Dynamic Trader Real Time and End Of Day
1 × $39.00
6 Dynamic Trader Real Time and End Of Day
1 × $39.00 -
×
 Tech Stock Valuation with Mark Hirschey
1 × $6.00
Tech Stock Valuation with Mark Hirschey
1 × $6.00 -
×
 Jesse Livermore Trading System with Joe Marwood - Marwood Research
1 × $15.00
Jesse Livermore Trading System with Joe Marwood - Marwood Research
1 × $15.00 -
×
 How I Quit my Job & Turned 6k into Half Million Trading Commodities with Bob Buran
1 × $4.00
How I Quit my Job & Turned 6k into Half Million Trading Commodities with Bob Buran
1 × $4.00 -
×
 Supply and Demand 2023 with Willy Jay
1 × $5.00
Supply and Demand 2023 with Willy Jay
1 × $5.00 -
×
 Cycle Trends Professional 2.3 Rear Time with Esignal cycletrends.co.za
1 × $6.00
Cycle Trends Professional 2.3 Rear Time with Esignal cycletrends.co.za
1 × $6.00 -
×
 LT Pulse and LT Trend/Ultra
1 × $23.00
LT Pulse and LT Trend/Ultra
1 × $23.00 -
×
 Foreign Exchange Option Pricing: A Practitioner's Guide with Iain Clark
1 × $6.00
Foreign Exchange Option Pricing: A Practitioner's Guide with Iain Clark
1 × $6.00 -
×
 Divergence Super BluePrint with Bill Poulos
1 × $6.00
Divergence Super BluePrint with Bill Poulos
1 × $6.00 -
×
 Linda Raschke Short Term Trading Strategies with David Vomund
1 × $6.00
Linda Raschke Short Term Trading Strategies with David Vomund
1 × $6.00 -
×
 Slump Busting Techniques with Linda Raschke
1 × $4.00
Slump Busting Techniques with Linda Raschke
1 × $4.00 -
×
 How to Make 1 Million Per Year Like Larry Williams with Larry Williams
1 × $6.00
How to Make 1 Million Per Year Like Larry Williams with Larry Williams
1 × $6.00 -
×
 Traders Seminars – 7 CD
1 × $31.00
Traders Seminars – 7 CD
1 × $31.00 -
×
 Street Smarts & TS Code with Larry Connors & Linda Bradford Rashcke
1 × $6.00
Street Smarts & TS Code with Larry Connors & Linda Bradford Rashcke
1 × $6.00 -
×
 Mastering The ICO: Spotting Needles In A Haystack with Alphashark
1 × $39.00
Mastering The ICO: Spotting Needles In A Haystack with Alphashark
1 × $39.00 -
×
 Real Options Analysis: Tools and Techniques for Valuing Strategic Investments and Decisions - Johnathan Mun
1 × $6.00
Real Options Analysis: Tools and Techniques for Valuing Strategic Investments and Decisions - Johnathan Mun
1 × $6.00 -
×
 Forecast 2024 Clarification with Larry Williams
1 × $15.00
Forecast 2024 Clarification with Larry Williams
1 × $15.00 -
×
 The Orderflows Trade Opportunities Encyclopedia with Michael Valtos
1 × $8.00
The Orderflows Trade Opportunities Encyclopedia with Michael Valtos
1 × $8.00 -
×
 Module II - Signature Trades with FX MindShift
1 × $6.00
Module II - Signature Trades with FX MindShift
1 × $6.00 -
×
 Beginner Boot Camp with Optionpit
1 × $62.00
Beginner Boot Camp with Optionpit
1 × $62.00 -
×
 Learn Plan Profit – How To Trade Stocks
1 × $15.00
Learn Plan Profit – How To Trade Stocks
1 × $15.00 -
×
 The Science of Trading with Mark Boucher
1 × $6.00
The Science of Trading with Mark Boucher
1 × $6.00 -
×
 Big Fish Trading Strategy with Dave Aquino
1 × $6.00
Big Fish Trading Strategy with Dave Aquino
1 × $6.00 -
×
 White Phoenix’s The Smart (Money) Approach to Trading with Jayson Casper
1 × $39.00
White Phoenix’s The Smart (Money) Approach to Trading with Jayson Casper
1 × $39.00 -
×
 Bodhi, Lighthouse, Truckin by Brian James Sklenka
1 × $6.00
Bodhi, Lighthouse, Truckin by Brian James Sklenka
1 × $6.00 -
×
 Candle Charting Essentials & Beyond Volume 1 & 2 with Steve Nison - Candle Charts
1 × $15.00
Candle Charting Essentials & Beyond Volume 1 & 2 with Steve Nison - Candle Charts
1 × $15.00 -
×
 Applications of Abstract Algebra with Maple - Richard E.Kline, Neil Sigmon, Ernst Stitzinger
1 × $6.00
Applications of Abstract Algebra with Maple - Richard E.Kline, Neil Sigmon, Ernst Stitzinger
1 × $6.00 -
×
 Practical Applications of Candlestick Charts with Gary Wagner
1 × $6.00
Practical Applications of Candlestick Charts with Gary Wagner
1 × $6.00 -
×
 Tape Reading Big Caps 1 on 1 with Jtrader
1 × $6.00
Tape Reading Big Caps 1 on 1 with Jtrader
1 × $6.00 -
×
 Options Plain & Simple with Lenni Jordan
1 × $6.00
Options Plain & Simple with Lenni Jordan
1 × $6.00 -
×
 0 DTE Options Trading Workshop with Aeromir Corporation
1 × $15.00
0 DTE Options Trading Workshop with Aeromir Corporation
1 × $15.00 -
×
 Practical Approach to Amibroker Scanners and Exploration with Rajandran R
1 × $4.00
Practical Approach to Amibroker Scanners and Exploration with Rajandran R
1 × $4.00 -
×
 Smart Money with Chart Engineers
1 × $7.00
Smart Money with Chart Engineers
1 × $7.00 -
×
 Earnings Power Play with Dave Aquino
1 × $15.00
Earnings Power Play with Dave Aquino
1 × $15.00 -
×
 A Grand Supercycle Top Webinar with Steven Hochberg
1 × $6.00
A Grand Supercycle Top Webinar with Steven Hochberg
1 × $6.00 -
×
 Shorting for Profit
1 × $31.00
Shorting for Profit
1 × $31.00 -
×
 Catching the Bounce
1 × $6.00
Catching the Bounce
1 × $6.00 -
×
 Bubbleology: The New Science of Stock Market Winners and Losers with Kevin Hassett
1 × $6.00
Bubbleology: The New Science of Stock Market Winners and Losers with Kevin Hassett
1 × $6.00 -
×
 BCFX 2,0 and 2,5 with Brandon Carter
1 × $5.00
BCFX 2,0 and 2,5 with Brandon Carter
1 × $5.00 -
×
 Insider Buying The Ultimate Leading Indicator with Alex Green
1 × $6.00
Insider Buying The Ultimate Leading Indicator with Alex Green
1 × $6.00 -
×
 FOREX GENERATION MASTER COURSE
1 × $6.00
FOREX GENERATION MASTER COURSE
1 × $6.00 -
×
 Market Consistency: Model Calibration in Imperfect Markets with Malcolm Kemp
1 × $6.00
Market Consistency: Model Calibration in Imperfect Markets with Malcolm Kemp
1 × $6.00 -
×
 W. D Gann 's Square Of 9 Applied To Modern Markets with Sean Avidar - Hexatrade350
1 × $23.00
W. D Gann 's Square Of 9 Applied To Modern Markets with Sean Avidar - Hexatrade350
1 × $23.00 -
×
 AstroScan Regulus 4.1E newastro.net
1 × $6.00
AstroScan Regulus 4.1E newastro.net
1 × $6.00 -
×
 Complete Series
1 × $31.00
Complete Series
1 × $31.00 -
×
 Stock Market Science and Technique
1 × $15.00
Stock Market Science and Technique
1 × $15.00 -
×
 Advanced Pattern Trader Course with Trade Empowered
1 × $23.00
Advanced Pattern Trader Course with Trade Empowered
1 × $23.00 -
×
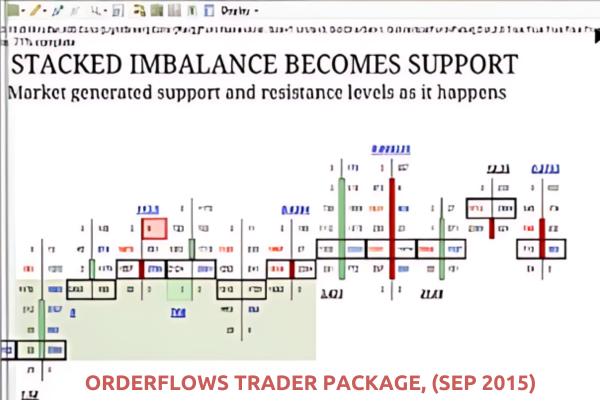 OrderFlows Trader Package, (Sep 2015)
1 × $54.00
OrderFlows Trader Package, (Sep 2015)
1 × $54.00 -
×
 AstuceFX Mentorship 2023
1 × $27.00
AstuceFX Mentorship 2023
1 × $27.00 -
×
 JeaFx 2023 with James Allen
1 × $5.00
JeaFx 2023 with James Allen
1 × $5.00 -
×
 Predicting Market Trends with Periodic Number Cycle
1 × $6.00
Predicting Market Trends with Periodic Number Cycle
1 × $6.00 -
×
 Forex Fury
1 × $23.00
Forex Fury
1 × $23.00 -
×
 EFT for Prevention and Treatment of Serious Diseases with Kari Dawson
1 × $6.00
EFT for Prevention and Treatment of Serious Diseases with Kari Dawson
1 × $6.00 -
×
 OTC Oracle Course - PENNY WHALE with Simple Trade
1 × $31.00
OTC Oracle Course - PENNY WHALE with Simple Trade
1 × $31.00 -
×
 FOREX CRASH COURSE - IYF - ONLINE SEMINAR
1 × $5.00
FOREX CRASH COURSE - IYF - ONLINE SEMINAR
1 × $5.00 -
×
 Trading Price Action Trading Ranges (Kindle) with Al Brooks
1 × $6.00
Trading Price Action Trading Ranges (Kindle) with Al Brooks
1 × $6.00 -
×
 Learn To Trade with Tori Trades
1 × $8.00
Learn To Trade with Tori Trades
1 × $8.00 -
×
 NY 6 - Jason McDonald – Why Shorts are Hard to Find and How You Can Find Great Shorts
1 × $6.00
NY 6 - Jason McDonald – Why Shorts are Hard to Find and How You Can Find Great Shorts
1 × $6.00 -
×
 Advanced Nuances & Exceptions eCourse with Jim Dalton
1 × $15.00
Advanced Nuances & Exceptions eCourse with Jim Dalton
1 × $15.00 -
×
 Fig Combo Course
1 × $5.00
Fig Combo Course
1 × $5.00 -
×
 Building Your E-Mini Trading Strategy with Daniel Gramza
1 × $6.00
Building Your E-Mini Trading Strategy with Daniel Gramza
1 × $6.00 -
×
 Value Investing Bootcamp with Nick Kraakman
1 × $15.00
Value Investing Bootcamp with Nick Kraakman
1 × $15.00 -
×
 AI For Traders with Trading Markets
1 × $31.00
AI For Traders with Trading Markets
1 × $31.00

Reading & Understanding Charts with Andrew Baxter
$6.00
File Size: 311MB
Delivery Time: 1–12 hours
Media Type: Online Course
Content Proof: Watch Here!
You may check content proof of “Reading & Understanding Chartsb with Andrew Baxter” below:

Reading & Understanding Charts with Andrew Baxter
Introduction to Chart Reading
Charts are essential tools for traders, providing visual representations of market data. Andrew Baxter, a renowned trader and educator, shares his expertise on how to read and understand charts effectively. This article will guide you through the basics and advanced techniques of chart reading, helping you make informed trading decisions.
What are Trading Charts?
Definition and Purpose
Trading charts are graphical representations of price movements over time. They help traders analyze trends, identify patterns, and make predictions about future price movements.
Importance of Chart Reading
Understanding charts is crucial for making data-driven decisions in trading. It reduces emotional trading and enhances your ability to spot opportunities and risks.
Types of Trading Charts
1. Line Charts
Line charts are the simplest form of trading charts, showing the closing prices over a period. They provide a clear view of the overall trend but lack detailed information.
2. Bar Charts
Bar charts display the opening, closing, high, and low prices for each period. They offer more information than line charts and help in understanding price volatility.
3. Candlestick Charts
Candlestick charts are popular due to their detailed and visually appealing format. Each candlestick shows the opening, closing, high, and low prices, making it easier to identify market sentiment.
Understanding Candlestick Charts
Components of a Candlestick
- Body: The filled part showing the opening and closing prices.
- Wicks/Shadows: The thin lines representing the high and low prices.
- Color: Indicates whether the closing price was higher (typically green) or lower (typically red) than the opening price.
Common Candlestick Patterns
1. Doji
A Doji occurs when the opening and closing prices are nearly the same, indicating indecision in the market.
2. Hammer
A Hammer has a small body with a long lower wick, suggesting a potential reversal from a downtrend.
3. Engulfing Pattern
An Engulfing pattern occurs when a larger candlestick completely engulfs the previous smaller candlestick, signaling a potential reversal.
Key Chart Patterns
1. Head and Shoulders
This pattern indicates a reversal and is formed by a peak (head) flanked by two smaller peaks (shoulders).
2. Double Top and Double Bottom
These patterns signal a potential reversal. A double top indicates a bearish reversal, while a double bottom suggests a bullish reversal.
3. Triangles
Triangles are continuation patterns that show a period of consolidation before the price continues in the direction of the previous trend.
Using Technical Indicators
1. Moving Averages
Moving averages smooth out price data to identify trends. Common types include Simple Moving Average (SMA) and Exponential Moving Average (EMA).
2. Relative Strength Index (RSI)
RSI measures the speed and change of price movements, indicating overbought or oversold conditions.
3. Moving Average Convergence Divergence (MACD)
MACD shows the relationship between two moving averages, helping to identify potential buy and sell signals.
Combining Chart Patterns and Indicators
Integrated Analysis
Combining chart patterns with technical indicators enhances the reliability of trading signals. For example, confirming a head and shoulders pattern with RSI divergence can provide a stronger signal.
Practical Application
Use a combination of patterns and indicators to develop a comprehensive trading strategy. This approach helps in making more informed and confident trading decisions.
Advanced Chart Reading Techniques
1. Fibonacci Retracement
Fibonacci retracement levels indicate potential support and resistance levels based on the Fibonacci sequence.
2. Volume Analysis
Volume analysis involves examining the number of shares traded to confirm the strength of a price movement or trend.
3. Divergence
Divergence occurs when the price moves in the opposite direction of an indicator, signaling a potential reversal.
Common Mistakes in Chart Reading
1. Overcomplicating Analysis
Avoid using too many indicators and patterns at once. Focus on a few reliable tools to keep your analysis clear and effective.
2. Ignoring Context
Always consider the broader market context and economic factors. Relying solely on charts without context can lead to misleading conclusions.
3. Emotional Trading
Stick to your analysis and avoid making decisions based on emotions. Emotional trading can undermine even the best chart reading skills.
Benefits of Mastering Chart Reading
1. Improved Decision Making
Accurate chart reading helps you make informed decisions, reducing the risk of losses and increasing the potential for gains.
2. Enhanced Trading Strategy
Understanding charts allows you to develop and refine your trading strategies, making them more effective and adaptable.
3. Increased Confidence
With better chart reading skills, you gain confidence in your trading decisions, leading to more consistent performance.
Conclusion
Reading and understanding charts with insights from Andrew Baxter can significantly improve your trading performance. By mastering various chart types, patterns, and technical indicators, you can make more informed decisions and develop robust trading strategies. Embrace these principles, continuously practice, and refine your skills to become a proficient trader.
Frequently Asked Questions:
What are the main types of trading charts?
The main types are line charts, bar charts, and candlestick charts.
Why are candlestick charts popular?
Candlestick charts are popular due to their detailed and visually appealing format, making it easier to identify market sentiment.
What are some common candlestick patterns?
Common patterns include Doji, Hammer, and Engulfing patterns.
How can technical indicators enhance chart reading?
Technical indicators like moving averages, RSI, and MACD help identify trends, momentum, and potential buy/sell signals.
What are some advanced chart reading techniques?
Advanced techniques include Fibonacci retracement, volume analysis, and divergence.
Be the first to review “Reading & Understanding Charts with Andrew Baxter”
You must be logged in to post a review.
Related products

Original price was: $497.00.$11.00Current price is: $11.00.

Original price was: $1,800.00.$54.00Current price is: $54.00.

Original price was: $450.00.$23.00Current price is: $23.00.

Original price was: $895.00.$15.00Current price is: $15.00.
Forex Trading
Original price was: $2,995.00.$31.00Current price is: $31.00.

Forex Trading
The Complete Guide to Multiple Time Frame Analysis & Reading Price Action with Aiman Almansoori
Original price was: $1,399.00.$13.00Current price is: $13.00.

Original price was: $649.00.$20.00Current price is: $20.00.

Original price was: $4,995.00.$15.00Current price is: $15.00.

Forex Trading
Original price was: $2,997.00.$23.00Current price is: $23.00.

Original price was: $497.00.$31.00Current price is: $31.00.
Forex Trading
Original price was: $999.00.$15.00Current price is: $15.00.

Forex Trading
Original price was: $1,098.00.$39.00Current price is: $39.00.

Original price was: $197.00.$5.00Current price is: $5.00.

Original price was: $1,849.00.$15.00Current price is: $15.00.
Original price was: $700.00.$39.00Current price is: $39.00.

Forex Trading
Original price was: $697.00.$5.00Current price is: $5.00.

Forex Trading
Original price was: $4,997.00.$27.00Current price is: $27.00.

Original price was: $997.00.$8.00Current price is: $8.00.

Forex Trading
Original price was: $499.00.$15.00Current price is: $15.00.
Forex Trading
Original price was: $249.00.$15.00Current price is: $15.00.

Reviews
There are no reviews yet.