-
×
 Elliott Wave Indicator Suite for ThinkorSwim
1 × $15.00
Elliott Wave Indicator Suite for ThinkorSwim
1 × $15.00 -
×
 Trade Australian Share CFDs with Brian Griffin
1 × $6.00
Trade Australian Share CFDs with Brian Griffin
1 × $6.00 -
×
 The Binary Trigger (Video, Books) with John Piper
1 × $6.00
The Binary Trigger (Video, Books) with John Piper
1 × $6.00 -
×
 Ultimate Trading Course with Dodgy's Dungeon
1 × $8.00
Ultimate Trading Course with Dodgy's Dungeon
1 × $8.00 -
×
 Investment Illusions with Martin S.Fridson
1 × $6.00
Investment Illusions with Martin S.Fridson
1 × $6.00 -
×
 Profitable Patterns for Stock Trading with Larry Pesavento
1 × $6.00
Profitable Patterns for Stock Trading with Larry Pesavento
1 × $6.00 -
×
 Stock Trader`s Almanac 2012 with Jeffrey Hirsch & Yale Hirsch
1 × $6.00
Stock Trader`s Almanac 2012 with Jeffrey Hirsch & Yale Hirsch
1 × $6.00 -
×
 Trading with MORE Special Set-ups - Recorded Webinar
1 × $15.00
Trading with MORE Special Set-ups - Recorded Webinar
1 × $15.00 -
×
 Advanced Spread Trading with Guy Bower - MasterClass Trader
1 × $15.00
Advanced Spread Trading with Guy Bower - MasterClass Trader
1 × $15.00 -
×
 How to Find the Most Profitable Stocks with Mubarak Shah
1 × $6.00
How to Find the Most Profitable Stocks with Mubarak Shah
1 × $6.00 -
×
 Computational Financial Mathematics with Mathematica
1 × $6.00
Computational Financial Mathematics with Mathematica
1 × $6.00 -
×
 Accelerated Learning Techniques in Action with Colin Rose, Jayne Nicholl & Malcolm Nicholl
1 × $6.00
Accelerated Learning Techniques in Action with Colin Rose, Jayne Nicholl & Malcolm Nicholl
1 × $6.00 -
×
 Complete Price Action, Volume Profile and Orderflow Trading Bundle with Price Action Volume Trader
1 × $78.00
Complete Price Action, Volume Profile and Orderflow Trading Bundle with Price Action Volume Trader
1 × $78.00 -
×
 Advanced Technical Strategies Home Study Course with T3 LIVE
1 × $31.00
Advanced Technical Strategies Home Study Course with T3 LIVE
1 × $31.00 -
×
 The Instagram DM Automation Playbook with Natasha Takahashi
1 × $6.00
The Instagram DM Automation Playbook with Natasha Takahashi
1 × $6.00 -
×
 Scalping is Fun Course with Peter Devaere
1 × $109.00
Scalping is Fun Course with Peter Devaere
1 × $109.00 -
×
 8 Year Presidential Election Pattern (Article) with Adam White
1 × $6.00
8 Year Presidential Election Pattern (Article) with Adam White
1 × $6.00 -
×
 Art & Science of Trend Trading Class with Jeff Bierman
1 × $6.00
Art & Science of Trend Trading Class with Jeff Bierman
1 × $6.00 -
×
 A+ Setups Big Caps Options with Jtrader
1 × $6.00
A+ Setups Big Caps Options with Jtrader
1 × $6.00 -
×
 T3 Live - The Simple Art of Trading
1 × $31.00
T3 Live - The Simple Art of Trading
1 × $31.00 -
×
 How I Trade Growth Stocks In Bull And Bear Markets
1 × $54.00
How I Trade Growth Stocks In Bull And Bear Markets
1 × $54.00 -
×
 Practical Applications of Candlestick Charts with Gary Wagner
1 × $6.00
Practical Applications of Candlestick Charts with Gary Wagner
1 × $6.00 -
×
 The A14 Weekly Option Strategy Workshop with Amy Meissner
1 × $23.00
The A14 Weekly Option Strategy Workshop with Amy Meissner
1 × $23.00 -
×
 Simpler Options - Double Diagonals Class
1 × $6.00
Simpler Options - Double Diagonals Class
1 × $6.00 -
×
 The Adventures of the Cycle Hunter. The Cyclist with Craig Bttlc
1 × $6.00
The Adventures of the Cycle Hunter. The Cyclist with Craig Bttlc
1 × $6.00 -
×
 Algo Trading Masterclass with Ali Casey - StatOasis
1 × $23.00
Algo Trading Masterclass with Ali Casey - StatOasis
1 × $23.00 -
×
 White Phoenix’s The Smart (Money) Approach to Trading with Jayson Casper
1 × $39.00
White Phoenix’s The Smart (Money) Approach to Trading with Jayson Casper
1 × $39.00 -
×
 Patterns of Speculation with Bertrand M.Roehner
1 × $6.00
Patterns of Speculation with Bertrand M.Roehner
1 × $6.00 -
×
 The Day Traders Fast Track Program
1 × $23.00
The Day Traders Fast Track Program
1 × $23.00 -
×
 Forex Secrets Exposed
1 × $15.00
Forex Secrets Exposed
1 × $15.00 -
×
 Matrix Spread Options Trading Course with Base Camp Trading
1 × $31.00
Matrix Spread Options Trading Course with Base Camp Trading
1 × $31.00 -
×
 Learn To Fish Part II - Generating Consistent Income Through Day Trading with Daniel
1 × $6.00
Learn To Fish Part II - Generating Consistent Income Through Day Trading with Daniel
1 × $6.00 -
×
 Guidelines for Analysis and Establishing a Trading Plan with Charles Drummond
1 × $6.00
Guidelines for Analysis and Establishing a Trading Plan with Charles Drummond
1 × $6.00 -
×
 Crypto Trading Academy with Cheeky Investor - Aussie Day Trader
1 × $13.00
Crypto Trading Academy with Cheeky Investor - Aussie Day Trader
1 × $13.00 -
×
 TradeCraft: Your Path to Peak Performance Trading By Adam Grimes
1 × $15.00
TradeCraft: Your Path to Peak Performance Trading By Adam Grimes
1 × $15.00 -
×
 Five Trading Trends of 2005 with Dan Denning
1 × $6.00
Five Trading Trends of 2005 with Dan Denning
1 × $6.00 -
×
 NJAT Trading Course with Not Just A Trade
1 × $6.00
NJAT Trading Course with Not Just A Trade
1 × $6.00 -
×
 Andy’s EMini Bar – 60 Min System
1 × $6.00
Andy’s EMini Bar – 60 Min System
1 × $6.00 -
×
 3 Steps To Supply/Demand + 3 Steps To Market Profile 10% Off Combined Price
1 × $23.00
3 Steps To Supply/Demand + 3 Steps To Market Profile 10% Off Combined Price
1 × $23.00 -
×
 Academy of Financial Trading Foundation Trading Programme Webinar
1 × $6.00
Academy of Financial Trading Foundation Trading Programme Webinar
1 × $6.00 -
×
 Forecast 2024 Clarification with Larry Williams
1 × $15.00
Forecast 2024 Clarification with Larry Williams
1 × $15.00 -
×
 Getting Started in Forex Trading Strategies with Michael Duane Archer
1 × $6.00
Getting Started in Forex Trading Strategies with Michael Duane Archer
1 × $6.00 -
×
 The Michanics of Futures Trading - Roy Habben
1 × $6.00
The Michanics of Futures Trading - Roy Habben
1 × $6.00 -
×
 Advanced Trading Course - Footprint Charts, Market Profile & TPO with Jayson Casper
1 × $31.00
Advanced Trading Course - Footprint Charts, Market Profile & TPO with Jayson Casper
1 × $31.00 -
×
 Secrets of the Darvas Trading System
1 × $6.00
Secrets of the Darvas Trading System
1 × $6.00 -
×
 Perfect Publishing System Elite with Johnny Andrews
1 × $6.00
Perfect Publishing System Elite with Johnny Andrews
1 × $6.00 -
×
 Best of the Best: Collars with Amy Meissner & Scott Ruble
1 × $15.00
Best of the Best: Collars with Amy Meissner & Scott Ruble
1 × $15.00 -
×
 The Psychology Of Trading with Brett N.Steenbarger
1 × $6.00
The Psychology Of Trading with Brett N.Steenbarger
1 × $6.00 -
×
 Deep Dive Butterfly Trading Strategy Class with SJG Trades
1 × $41.00
Deep Dive Butterfly Trading Strategy Class with SJG Trades
1 × $41.00 -
×
 Fundamentals Trading
1 × $6.00
Fundamentals Trading
1 × $6.00 -
×
 Dynamic Time Cycles with Peter Eliades
1 × $6.00
Dynamic Time Cycles with Peter Eliades
1 × $6.00 -
×
 The 4 Horsemen CD with David Elliott
1 × $6.00
The 4 Horsemen CD with David Elliott
1 × $6.00 -
×
 Cyber Trading University - Power Trading 7 CD
1 × $8.00
Cyber Trading University - Power Trading 7 CD
1 × $8.00 -
×
 W. D Gann 's Square Of 9 Applied To Modern Markets with Sean Avidar - Hexatrade350
1 × $23.00
W. D Gann 's Square Of 9 Applied To Modern Markets with Sean Avidar - Hexatrade350
1 × $23.00 -
×
 Trading a Living Thing (Article) with David Bowden
1 × $6.00
Trading a Living Thing (Article) with David Bowden
1 × $6.00 -
×
 Foundation of Successful Trading - 2 DVDs and Bonus Gann Time Factor 2 DVDs
1 × $31.00
Foundation of Successful Trading - 2 DVDs and Bonus Gann Time Factor 2 DVDs
1 × $31.00 -
×
 Profiletraders - MARKET PROFILE TACTICAL STRATEGIES FOR DAY TRADING
1 × $23.00
Profiletraders - MARKET PROFILE TACTICAL STRATEGIES FOR DAY TRADING
1 × $23.00 -
×
 A Comparison of Popular Trading Systems (2nd Ed.) with Lars Kestner
1 × $6.00
A Comparison of Popular Trading Systems (2nd Ed.) with Lars Kestner
1 × $6.00 -
×
 Scalp Strategy and Flipping Small Accounts with Opes Trading Group
1 × $5.00
Scalp Strategy and Flipping Small Accounts with Opes Trading Group
1 × $5.00 -
×
 The Apple Way with Jeffrey Cruikshank
1 × $6.00
The Apple Way with Jeffrey Cruikshank
1 × $6.00 -
×
 Market Stalkers Level 3 - Intraday Trading University
1 × $8.00
Market Stalkers Level 3 - Intraday Trading University
1 × $8.00 -
×
 Financial Fortress with TradeSmart University
1 × $6.00
Financial Fortress with TradeSmart University
1 × $6.00 -
×
 Trading Economic Data System with CopperChips
1 × $6.00
Trading Economic Data System with CopperChips
1 × $6.00 -
×
 Order flow self-study training program with iMFtracker
1 × $10.00
Order flow self-study training program with iMFtracker
1 × $10.00 -
×
 Pristine - Oliver Velez – Swing Trading Tactics 2001
1 × $6.00
Pristine - Oliver Velez – Swing Trading Tactics 2001
1 × $6.00 -
×
 8 Successful Iron Condor Methodologies with Dan Sheridan
1 × $23.00
8 Successful Iron Condor Methodologies with Dan Sheridan
1 × $23.00 -
×
 WondaFX Signature Strategy with WondaFX
1 × $5.00
WondaFX Signature Strategy with WondaFX
1 × $5.00 -
×
 Crystal Ball Pack PLUS bonus Live Trade By Pat Mitchell - Trick Trades
1 × $20.00
Crystal Ball Pack PLUS bonus Live Trade By Pat Mitchell - Trick Trades
1 × $20.00 -
×
 Quantifiable Edges – Gold Subscription with Rob Hanna
1 × $54.00
Quantifiable Edges – Gold Subscription with Rob Hanna
1 × $54.00 -
×
 European Members - March 2023 with Stockbee
1 × $5.00
European Members - March 2023 with Stockbee
1 × $5.00 -
×
 A Course in Trading with Donald Mack & Wetsel Market Bureau
1 × $6.00
A Course in Trading with Donald Mack & Wetsel Market Bureau
1 × $6.00 -
×
 Advanced Swing Trading with John Crane
1 × $6.00
Advanced Swing Trading with John Crane
1 × $6.00 -
×
 Gap Trading for Stock and Options Traders with Damon Verial
1 × $6.00
Gap Trading for Stock and Options Traders with Damon Verial
1 × $6.00 -
×
 0 DTE Options Trading Workshop with Aeromir Corporation
1 × $15.00
0 DTE Options Trading Workshop with Aeromir Corporation
1 × $15.00 -
×
 The Best Option Trading Course with David Jaffee - Best Stock Strategy
1 × $15.00
The Best Option Trading Course with David Jaffee - Best Stock Strategy
1 × $15.00 -
×
 Trading Short TermSame Day Trades Sep 2023 with Dan Sheridan & Mark Fenton - Sheridan Options Mentoring
1 × $31.00
Trading Short TermSame Day Trades Sep 2023 with Dan Sheridan & Mark Fenton - Sheridan Options Mentoring
1 × $31.00 -
×
 Fantastic 4 Trading Strategies
1 × $15.00
Fantastic 4 Trading Strategies
1 × $15.00 -
×
 ADR Pro For Metatrader 4.0 with Compass FX
1 × $15.00
ADR Pro For Metatrader 4.0 with Compass FX
1 × $15.00 -
×
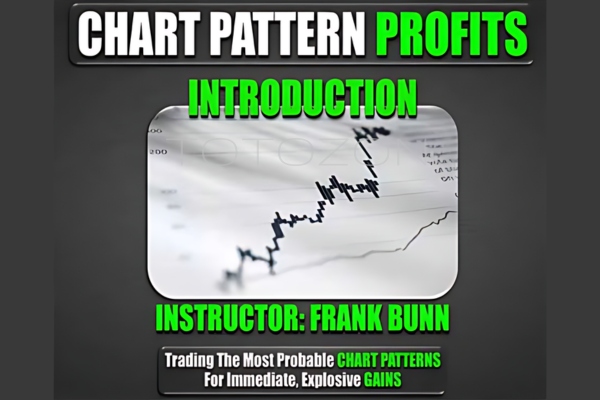 Chart Pattern Profits
1 × $6.00
Chart Pattern Profits
1 × $6.00 -
×
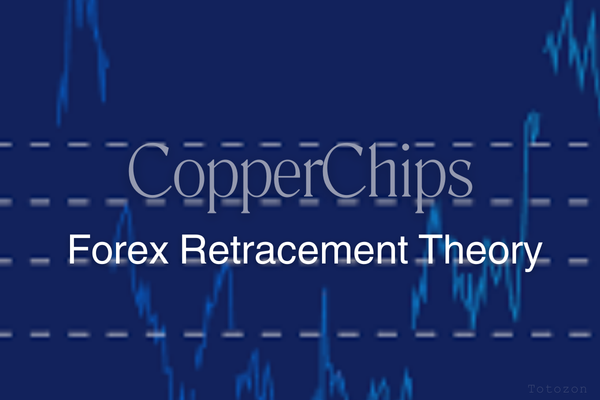 Forex Retracement Theory with CopperChips
1 × $6.00
Forex Retracement Theory with CopperChips
1 × $6.00 -
×
 Fibonacci Ratios with Pattern Recognition - Larry Pesavento & Steven Shapiro
1 × $6.00
Fibonacci Ratios with Pattern Recognition - Larry Pesavento & Steven Shapiro
1 × $6.00 -
×
 The Complete XAUUSD GOLD Forex Scalping System On Real Trading Account with Forex Lia
1 × $5.00
The Complete XAUUSD GOLD Forex Scalping System On Real Trading Account with Forex Lia
1 × $5.00 -
×
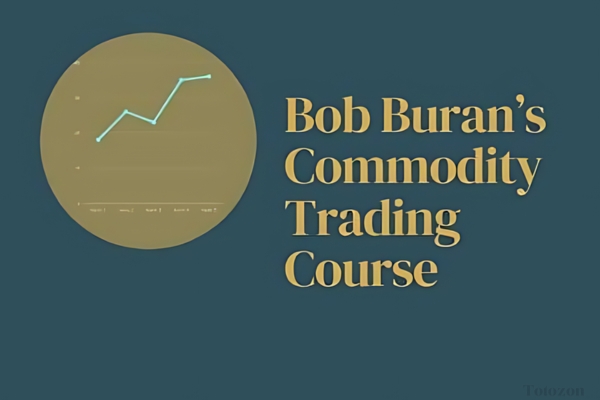 Commodity Trading Video Course with Bob Buran
1 × $6.00
Commodity Trading Video Course with Bob Buran
1 × $6.00 -
×
 Quantamentals - The Next Great Forefront Of Trading and Investing with Trading Markets
1 × $8.00
Quantamentals - The Next Great Forefront Of Trading and Investing with Trading Markets
1 × $8.00 -
×
 TRADING NFX Course with Andrew NFX
1 × $5.00
TRADING NFX Course with Andrew NFX
1 × $5.00 -
×
 Candlestick Secrets For Profiting In Options
1 × $23.00
Candlestick Secrets For Profiting In Options
1 × $23.00

Reading & Understanding Charts with Andrew Baxter
$6.00
File Size: 311MB
Delivery Time: 1–12 hours
Media Type: Online Course
Content Proof: Watch Here!
You may check content proof of “Reading & Understanding Chartsb with Andrew Baxter” below:

Reading & Understanding Charts with Andrew Baxter
Introduction to Chart Reading
Charts are essential tools for traders, providing visual representations of market data. Andrew Baxter, a renowned trader and educator, shares his expertise on how to read and understand charts effectively. This article will guide you through the basics and advanced techniques of chart reading, helping you make informed trading decisions.
What are Trading Charts?
Definition and Purpose
Trading charts are graphical representations of price movements over time. They help traders analyze trends, identify patterns, and make predictions about future price movements.
Importance of Chart Reading
Understanding charts is crucial for making data-driven decisions in trading. It reduces emotional trading and enhances your ability to spot opportunities and risks.
Types of Trading Charts
1. Line Charts
Line charts are the simplest form of trading charts, showing the closing prices over a period. They provide a clear view of the overall trend but lack detailed information.
2. Bar Charts
Bar charts display the opening, closing, high, and low prices for each period. They offer more information than line charts and help in understanding price volatility.
3. Candlestick Charts
Candlestick charts are popular due to their detailed and visually appealing format. Each candlestick shows the opening, closing, high, and low prices, making it easier to identify market sentiment.
Understanding Candlestick Charts
Components of a Candlestick
- Body: The filled part showing the opening and closing prices.
- Wicks/Shadows: The thin lines representing the high and low prices.
- Color: Indicates whether the closing price was higher (typically green) or lower (typically red) than the opening price.
Common Candlestick Patterns
1. Doji
A Doji occurs when the opening and closing prices are nearly the same, indicating indecision in the market.
2. Hammer
A Hammer has a small body with a long lower wick, suggesting a potential reversal from a downtrend.
3. Engulfing Pattern
An Engulfing pattern occurs when a larger candlestick completely engulfs the previous smaller candlestick, signaling a potential reversal.
Key Chart Patterns
1. Head and Shoulders
This pattern indicates a reversal and is formed by a peak (head) flanked by two smaller peaks (shoulders).
2. Double Top and Double Bottom
These patterns signal a potential reversal. A double top indicates a bearish reversal, while a double bottom suggests a bullish reversal.
3. Triangles
Triangles are continuation patterns that show a period of consolidation before the price continues in the direction of the previous trend.
Using Technical Indicators
1. Moving Averages
Moving averages smooth out price data to identify trends. Common types include Simple Moving Average (SMA) and Exponential Moving Average (EMA).
2. Relative Strength Index (RSI)
RSI measures the speed and change of price movements, indicating overbought or oversold conditions.
3. Moving Average Convergence Divergence (MACD)
MACD shows the relationship between two moving averages, helping to identify potential buy and sell signals.
Combining Chart Patterns and Indicators
Integrated Analysis
Combining chart patterns with technical indicators enhances the reliability of trading signals. For example, confirming a head and shoulders pattern with RSI divergence can provide a stronger signal.
Practical Application
Use a combination of patterns and indicators to develop a comprehensive trading strategy. This approach helps in making more informed and confident trading decisions.
Advanced Chart Reading Techniques
1. Fibonacci Retracement
Fibonacci retracement levels indicate potential support and resistance levels based on the Fibonacci sequence.
2. Volume Analysis
Volume analysis involves examining the number of shares traded to confirm the strength of a price movement or trend.
3. Divergence
Divergence occurs when the price moves in the opposite direction of an indicator, signaling a potential reversal.
Common Mistakes in Chart Reading
1. Overcomplicating Analysis
Avoid using too many indicators and patterns at once. Focus on a few reliable tools to keep your analysis clear and effective.
2. Ignoring Context
Always consider the broader market context and economic factors. Relying solely on charts without context can lead to misleading conclusions.
3. Emotional Trading
Stick to your analysis and avoid making decisions based on emotions. Emotional trading can undermine even the best chart reading skills.
Benefits of Mastering Chart Reading
1. Improved Decision Making
Accurate chart reading helps you make informed decisions, reducing the risk of losses and increasing the potential for gains.
2. Enhanced Trading Strategy
Understanding charts allows you to develop and refine your trading strategies, making them more effective and adaptable.
3. Increased Confidence
With better chart reading skills, you gain confidence in your trading decisions, leading to more consistent performance.
Conclusion
Reading and understanding charts with insights from Andrew Baxter can significantly improve your trading performance. By mastering various chart types, patterns, and technical indicators, you can make more informed decisions and develop robust trading strategies. Embrace these principles, continuously practice, and refine your skills to become a proficient trader.
Frequently Asked Questions:
What are the main types of trading charts?
The main types are line charts, bar charts, and candlestick charts.
Why are candlestick charts popular?
Candlestick charts are popular due to their detailed and visually appealing format, making it easier to identify market sentiment.
What are some common candlestick patterns?
Common patterns include Doji, Hammer, and Engulfing patterns.
How can technical indicators enhance chart reading?
Technical indicators like moving averages, RSI, and MACD help identify trends, momentum, and potential buy/sell signals.
What are some advanced chart reading techniques?
Advanced techniques include Fibonacci retracement, volume analysis, and divergence.
Be the first to review “Reading & Understanding Charts with Andrew Baxter”
You must be logged in to post a review.
Related products

Original price was: $450.00.$23.00Current price is: $23.00.

Original price was: $299.00.$8.00Current price is: $8.00.
Original price was: $310.00.$23.00Current price is: $23.00.

Forex Trading
Original price was: $697.00.$5.00Current price is: $5.00.

Original price was: $997.00.$8.00Current price is: $8.00.
Original price was: $895.00.$15.00Current price is: $15.00.

Forex Trading
The Complete Guide to Multiple Time Frame Analysis & Reading Price Action with Aiman Almansoori
Original price was: $1,399.00.$13.00Current price is: $13.00.
Original price was: $799.00.$15.00Current price is: $15.00.

Original price was: $497.00.$11.00Current price is: $11.00.
Forex Trading
Original price was: $239.00.$8.00Current price is: $8.00.

Forex Trading
Original price was: $850.00.$23.00Current price is: $23.00.

Forex Trading
Original price was: $4,997.00.$27.00Current price is: $27.00.
Original price was: $700.00.$39.00Current price is: $39.00.

Original price was: $197.00.$5.00Current price is: $5.00.
Forex Trading
Original price was: $249.00.$15.00Current price is: $15.00.

Forex Trading
Original price was: $2,995.00.$31.00Current price is: $31.00.

Original price was: $2,120.00.$15.00Current price is: $15.00.

Forex Trading
Original price was: $1,098.00.$39.00Current price is: $39.00.
Original price was: $997.00.$13.00Current price is: $13.00.

Forex Trading
Original price was: $2,997.00.$23.00Current price is: $23.00.

Reviews
There are no reviews yet.