-
×
 Cryptocurrency Investment Course 2021 Fund your Retirement with Suppoman
1 × $5.00
Cryptocurrency Investment Course 2021 Fund your Retirement with Suppoman
1 × $5.00 -
×
 Stock Market Wizards Interviews with America’s Top Stock Traders - Jack Schwager
1 × $6.00
Stock Market Wizards Interviews with America’s Top Stock Traders - Jack Schwager
1 × $6.00 -
×
 New Blueprints for Gains in Stocks and Grains & One-Way Formula for Trading in Stocks and Commodities (Traders' Masterclass) - William Dunnigan
1 × $6.00
New Blueprints for Gains in Stocks and Grains & One-Way Formula for Trading in Stocks and Commodities (Traders' Masterclass) - William Dunnigan
1 × $6.00 -
×
 Stock Trading Strategies Technical Analysis MasterClass 2 with Jyoti Bansal
1 × $6.00
Stock Trading Strategies Technical Analysis MasterClass 2 with Jyoti Bansal
1 × $6.00 -
×
 Online Course - Why Wave Analysis Belongs in Every Trader's Toolbox with Jeffrey Kennedy - Elliott Wave
1 × $15.00
Online Course - Why Wave Analysis Belongs in Every Trader's Toolbox with Jeffrey Kennedy - Elliott Wave
1 × $15.00 -
×
 Successful Stock Speculation (1922) with John James
1 × $6.00
Successful Stock Speculation (1922) with John James
1 × $6.00 -
×
 Earnings Engine with Sami Abusaad - T3 Live
1 × $6.00
Earnings Engine with Sami Abusaad - T3 Live
1 × $6.00 -
×
 Pro Trader Boot Camp Home Study with Derrick Oldensmith - T3 Live
1 × $31.00
Pro Trader Boot Camp Home Study with Derrick Oldensmith - T3 Live
1 × $31.00 -
×
 Mind & Markets. An Advanced Study Course of Stock Market Education (1951) with Bert Larson
1 × $6.00
Mind & Markets. An Advanced Study Course of Stock Market Education (1951) with Bert Larson
1 × $6.00 -
×
 Channel Analysis. The Key to Improved Timing of Trades with Brian J.Millard
1 × $6.00
Channel Analysis. The Key to Improved Timing of Trades with Brian J.Millard
1 × $6.00 -
×
 NetPicks - Universal Market Trader Course
1 × $6.00
NetPicks - Universal Market Trader Course
1 × $6.00 -
×
 The Complete Short Course on Ripple Cryptocurrency with Saad Hameed
1 × $5.00
The Complete Short Course on Ripple Cryptocurrency with Saad Hameed
1 × $5.00 -
×
 AnkhFX Academy Course
1 × $17.00
AnkhFX Academy Course
1 × $17.00 -
×
 Quantamentals - The Next Great Forefront Of Trading and Investing with Trading Markets
1 × $8.00
Quantamentals - The Next Great Forefront Of Trading and Investing with Trading Markets
1 × $8.00 -
×
 Matrix Spread Options Trading Course with Base Camp Trading
1 × $31.00
Matrix Spread Options Trading Course with Base Camp Trading
1 × $31.00 -
×
 Arcane 2.0 Course
1 × $6.00
Arcane 2.0 Course
1 × $6.00 -
×
 Freedom Challenge Course with Steven Dux
1 × $5.00
Freedom Challenge Course with Steven Dux
1 × $5.00 -
×
 Complete Cryptocurrency Trading 2021
1 × $5.00
Complete Cryptocurrency Trading 2021
1 × $5.00 -
×
 Carolyn Boroden Package
1 × $15.00
Carolyn Boroden Package
1 × $15.00 -
×
 The Risk-Wise Investor: How to Better Understand and Manage Risk with Michael Carpenter
1 × $6.00
The Risk-Wise Investor: How to Better Understand and Manage Risk with Michael Carpenter
1 × $6.00 -
×
 Humbled Trader Academy
1 × $5.00
Humbled Trader Academy
1 × $5.00 -
×
 White Phoenix’s The Smart (Money) Approach to Trading with Jayson Casper
1 × $39.00
White Phoenix’s The Smart (Money) Approach to Trading with Jayson Casper
1 × $39.00 -
×
 W.D. Gann’s Secret Divergence Method with Hexatrade350
1 × $5.00
W.D. Gann’s Secret Divergence Method with Hexatrade350
1 × $5.00 -
×
 Steady Compounding Investing Academy Course with Steady Compounding
1 × $55.00
Steady Compounding Investing Academy Course with Steady Compounding
1 × $55.00 -
×
 The Complete Lot Flipper System
1 × $6.00
The Complete Lot Flipper System
1 × $6.00 -
×
 Original Curriculum with Home Options Trading Course
1 × $6.00
Original Curriculum with Home Options Trading Course
1 × $6.00 -
×
 Scalp Strategy and Flipping Small Accounts with Opes Trading Group
1 × $5.00
Scalp Strategy and Flipping Small Accounts with Opes Trading Group
1 × $5.00 -
×
 ShredderFX Compete Courses & Indicators
1 × $6.00
ShredderFX Compete Courses & Indicators
1 × $6.00 -
×
 Simple Setups For Consistent Profits with Base Camp Trading
1 × $6.00
Simple Setups For Consistent Profits with Base Camp Trading
1 × $6.00 -
×
 Cycle Hunter Support with Brian James Sklenka
1 × $6.00
Cycle Hunter Support with Brian James Sklenka
1 × $6.00 -
×
 Power Combo with Random Walk Trading
1 × $15.00
Power Combo with Random Walk Trading
1 × $15.00 -
×
 Futures Spread Trading Intro Course with Thetradingframework
1 × $6.00
Futures Spread Trading Intro Course with Thetradingframework
1 × $6.00 -
×
 The Janus Factor with Gary Anderson
1 × $6.00
The Janus Factor with Gary Anderson
1 × $6.00 -
×
 Simpler Options - Stock Trading Patterns
1 × $6.00
Simpler Options - Stock Trading Patterns
1 × $6.00 -
×
 Trading Masterclass XVII with Wysetrade
1 × $6.00
Trading Masterclass XVII with Wysetrade
1 × $6.00 -
×
 Trading With DiNapoli Levels
1 × $6.00
Trading With DiNapoli Levels
1 × $6.00 -
×
 Algo Trading Strategies 2017 with Autotrading Academy
1 × $6.00
Algo Trading Strategies 2017 with Autotrading Academy
1 × $6.00 -
×
 Gann Wheel 1.2.15 (globalviewtech.com)
1 × $6.00
Gann Wheel 1.2.15 (globalviewtech.com)
1 × $6.00 -
×
 Market Profile Video with FutexLive
1 × $6.00
Market Profile Video with FutexLive
1 × $6.00 -
×
 Home Run Options Trading Course with Dave Aquino - Base Camp Trading
1 × $11.00
Home Run Options Trading Course with Dave Aquino - Base Camp Trading
1 × $11.00 -
×
 A Complete Guide to Technical Trading Tactics with John Person
1 × $6.00
A Complete Guide to Technical Trading Tactics with John Person
1 × $6.00 -
×
 AI For Traders with Trading Markets
1 × $31.00
AI For Traders with Trading Markets
1 × $31.00 -
×
 The Best Option Trading Course with David Jaffee - Best Stock Strategy
1 × $15.00
The Best Option Trading Course with David Jaffee - Best Stock Strategy
1 × $15.00 -
×
 Pristine - Dan Gibby – Market Preparation Trading Gaps & Trading the Open
1 × $6.00
Pristine - Dan Gibby – Market Preparation Trading Gaps & Trading the Open
1 × $6.00 -
×
 Maximum Returns with Infinity Spreads Class with Don Kaufman
1 × $6.00
Maximum Returns with Infinity Spreads Class with Don Kaufman
1 × $6.00 -
×
 The BULLFx Forex Trading Course
1 × $5.00
The BULLFx Forex Trading Course
1 × $5.00 -
×
 9-Pack of TOS Indicators
1 × $6.00
9-Pack of TOS Indicators
1 × $6.00 -
×
 Multi Asset Class Investment Strategy with Guy Fraser-Sampson
1 × $6.00
Multi Asset Class Investment Strategy with Guy Fraser-Sampson
1 × $6.00 -
×
 Activedaytrader - Workshop: Practical Money Management
1 × $23.00
Activedaytrader - Workshop: Practical Money Management
1 × $23.00 -
×
 PFAZoneSuite [Trading Indicator] 2017
1 × $109.00
PFAZoneSuite [Trading Indicator] 2017
1 × $109.00 -
×
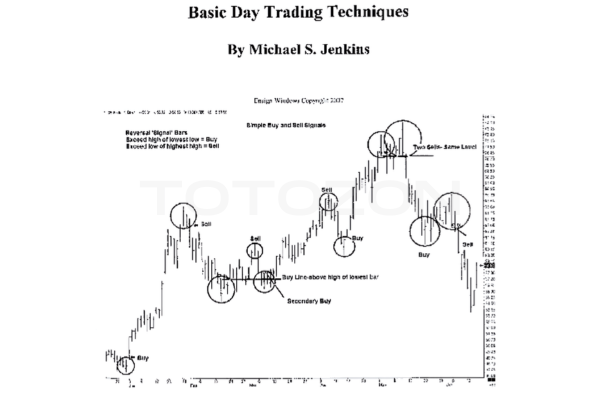 Basic Day Trading Techniques with Michael Jenkins
1 × $6.00
Basic Day Trading Techniques with Michael Jenkins
1 × $6.00 -
×
 How to Make the Stock Market Make Money For You with Ted Warren
1 × $6.00
How to Make the Stock Market Make Money For You with Ted Warren
1 × $6.00 -
×
 The Game In WallStreet & How to Play it Successfully with Hoyle
1 × $6.00
The Game In WallStreet & How to Play it Successfully with Hoyle
1 × $6.00 -
×
 Gold Trading Academy Video Course
1 × $23.00
Gold Trading Academy Video Course
1 × $23.00 -
×
 ICT Prodigy Trading Course – $650K in Payouts with Alex Solignani
1 × $15.00
ICT Prodigy Trading Course – $650K in Payouts with Alex Solignani
1 × $15.00

Reading & Understanding Charts with Andrew Baxter
$6.00
File Size: 311MB
Delivery Time: 1–12 hours
Media Type: Online Course
Content Proof: Watch Here!
You may check content proof of “Reading & Understanding Chartsb with Andrew Baxter” below:

Reading & Understanding Charts with Andrew Baxter
Introduction to Chart Reading
Charts are essential tools for traders, providing visual representations of market data. Andrew Baxter, a renowned trader and educator, shares his expertise on how to read and understand charts effectively. This article will guide you through the basics and advanced techniques of chart reading, helping you make informed trading decisions.
What are Trading Charts?
Definition and Purpose
Trading charts are graphical representations of price movements over time. They help traders analyze trends, identify patterns, and make predictions about future price movements.
Importance of Chart Reading
Understanding charts is crucial for making data-driven decisions in trading. It reduces emotional trading and enhances your ability to spot opportunities and risks.
Types of Trading Charts
1. Line Charts
Line charts are the simplest form of trading charts, showing the closing prices over a period. They provide a clear view of the overall trend but lack detailed information.
2. Bar Charts
Bar charts display the opening, closing, high, and low prices for each period. They offer more information than line charts and help in understanding price volatility.
3. Candlestick Charts
Candlestick charts are popular due to their detailed and visually appealing format. Each candlestick shows the opening, closing, high, and low prices, making it easier to identify market sentiment.
Understanding Candlestick Charts
Components of a Candlestick
- Body: The filled part showing the opening and closing prices.
- Wicks/Shadows: The thin lines representing the high and low prices.
- Color: Indicates whether the closing price was higher (typically green) or lower (typically red) than the opening price.
Common Candlestick Patterns
1. Doji
A Doji occurs when the opening and closing prices are nearly the same, indicating indecision in the market.
2. Hammer
A Hammer has a small body with a long lower wick, suggesting a potential reversal from a downtrend.
3. Engulfing Pattern
An Engulfing pattern occurs when a larger candlestick completely engulfs the previous smaller candlestick, signaling a potential reversal.
Key Chart Patterns
1. Head and Shoulders
This pattern indicates a reversal and is formed by a peak (head) flanked by two smaller peaks (shoulders).
2. Double Top and Double Bottom
These patterns signal a potential reversal. A double top indicates a bearish reversal, while a double bottom suggests a bullish reversal.
3. Triangles
Triangles are continuation patterns that show a period of consolidation before the price continues in the direction of the previous trend.
Using Technical Indicators
1. Moving Averages
Moving averages smooth out price data to identify trends. Common types include Simple Moving Average (SMA) and Exponential Moving Average (EMA).
2. Relative Strength Index (RSI)
RSI measures the speed and change of price movements, indicating overbought or oversold conditions.
3. Moving Average Convergence Divergence (MACD)
MACD shows the relationship between two moving averages, helping to identify potential buy and sell signals.
Combining Chart Patterns and Indicators
Integrated Analysis
Combining chart patterns with technical indicators enhances the reliability of trading signals. For example, confirming a head and shoulders pattern with RSI divergence can provide a stronger signal.
Practical Application
Use a combination of patterns and indicators to develop a comprehensive trading strategy. This approach helps in making more informed and confident trading decisions.
Advanced Chart Reading Techniques
1. Fibonacci Retracement
Fibonacci retracement levels indicate potential support and resistance levels based on the Fibonacci sequence.
2. Volume Analysis
Volume analysis involves examining the number of shares traded to confirm the strength of a price movement or trend.
3. Divergence
Divergence occurs when the price moves in the opposite direction of an indicator, signaling a potential reversal.
Common Mistakes in Chart Reading
1. Overcomplicating Analysis
Avoid using too many indicators and patterns at once. Focus on a few reliable tools to keep your analysis clear and effective.
2. Ignoring Context
Always consider the broader market context and economic factors. Relying solely on charts without context can lead to misleading conclusions.
3. Emotional Trading
Stick to your analysis and avoid making decisions based on emotions. Emotional trading can undermine even the best chart reading skills.
Benefits of Mastering Chart Reading
1. Improved Decision Making
Accurate chart reading helps you make informed decisions, reducing the risk of losses and increasing the potential for gains.
2. Enhanced Trading Strategy
Understanding charts allows you to develop and refine your trading strategies, making them more effective and adaptable.
3. Increased Confidence
With better chart reading skills, you gain confidence in your trading decisions, leading to more consistent performance.
Conclusion
Reading and understanding charts with insights from Andrew Baxter can significantly improve your trading performance. By mastering various chart types, patterns, and technical indicators, you can make more informed decisions and develop robust trading strategies. Embrace these principles, continuously practice, and refine your skills to become a proficient trader.
Frequently Asked Questions:
What are the main types of trading charts?
The main types are line charts, bar charts, and candlestick charts.
Why are candlestick charts popular?
Candlestick charts are popular due to their detailed and visually appealing format, making it easier to identify market sentiment.
What are some common candlestick patterns?
Common patterns include Doji, Hammer, and Engulfing patterns.
How can technical indicators enhance chart reading?
Technical indicators like moving averages, RSI, and MACD help identify trends, momentum, and potential buy/sell signals.
What are some advanced chart reading techniques?
Advanced techniques include Fibonacci retracement, volume analysis, and divergence.
Be the first to review “Reading & Understanding Charts with Andrew Baxter”
You must be logged in to post a review.
Related products

Original price was: $450.00.$23.00Current price is: $23.00.

Forex Trading
Original price was: $239.00.$8.00Current price is: $8.00.

Original price was: $695.00.$41.00Current price is: $41.00.

Forex Trading
Original price was: $697.00.$5.00Current price is: $5.00.

Forex Trading
Original price was: $999.00.$15.00Current price is: $15.00.

Original price was: $1,200.00.$23.00Current price is: $23.00.
Original price was: $1,849.00.$15.00Current price is: $15.00.

Original price was: $197.00.$5.00Current price is: $5.00.

Forex Trading
Original price was: $125.00.$17.00Current price is: $17.00.

Original price was: $299.00.$8.00Current price is: $8.00.

Original price was: $649.00.$20.00Current price is: $20.00.
Forex Trading
Quantamentals – The Next Great Forefront Of Trading and Investing with Trading Markets
Original price was: $1,495.00.$8.00Current price is: $8.00.

Original price was: $799.00.$15.00Current price is: $15.00.
Forex Trading
Original price was: $1,898.00.$10.00Current price is: $10.00.
Original price was: $999.00.$5.00Current price is: $5.00.
Original price was: $700.00.$39.00Current price is: $39.00.

Original price was: $997.00.$13.00Current price is: $13.00.

Forex Trading
Original price was: $797.00.$10.00Current price is: $10.00.

Original price was: $310.00.$23.00Current price is: $23.00.

Forex Trading
Original price was: $500.00.$5.00Current price is: $5.00.

Reviews
There are no reviews yet.