-
×
 Kaizen On-Demand By Candle Charts
1 × $6.00
Kaizen On-Demand By Candle Charts
1 × $6.00 -
×
 All About Bonds & Mutual Funds with Esme Faerber
1 × $6.00
All About Bonds & Mutual Funds with Esme Faerber
1 × $6.00 -
×
 How To Read The Market Professionally with TradeSmart
1 × $27.00
How To Read The Market Professionally with TradeSmart
1 × $27.00 -
×
 Deflaction with A.Gary Shilling
1 × $6.00
Deflaction with A.Gary Shilling
1 × $6.00 -
×
 Bond Market Course with The Macro Compass
1 × $15.00
Bond Market Course with The Macro Compass
1 × $15.00 -
×
 RROP Course 2023
1 × $5.00
RROP Course 2023
1 × $5.00 -
×
 Tail Hedging - Learn to Insure Stocks Against Large Declines with James Marsh
1 × $15.00
Tail Hedging - Learn to Insure Stocks Against Large Declines with James Marsh
1 × $15.00 -
×
 How to Spot Trading Opportunities
1 × $6.00
How to Spot Trading Opportunities
1 × $6.00 -
×
 Increasing Vertical Spread Probabilities With Technical Analysis Class with Doc Severso
1 × $6.00
Increasing Vertical Spread Probabilities With Technical Analysis Class with Doc Severso
1 × $6.00 -
×
 Equity Valuation for Analysts and Investors: A Unique Stock Valuation Tool for Financial Statement Analysis and Model-Building with James Kelleher
1 × $6.00
Equity Valuation for Analysts and Investors: A Unique Stock Valuation Tool for Financial Statement Analysis and Model-Building with James Kelleher
1 × $6.00 -
×
 Ichimokutrade - Elliot Wave 101
1 × $15.00
Ichimokutrade - Elliot Wave 101
1 × $15.00 -
×
 Profinacci Complete Course with Stephen A.Pierce
1 × $6.00
Profinacci Complete Course with Stephen A.Pierce
1 × $6.00 -
×
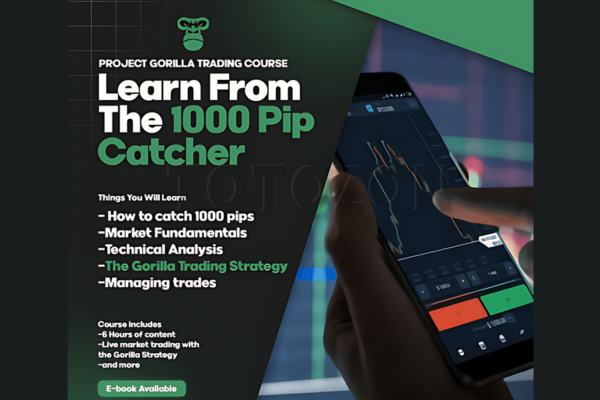 Project Gorilla
1 × $5.00
Project Gorilla
1 × $5.00 -
×
 Pairs Trading: Quantitative Methods and Analysis with Ganapathy Vidyamurthy
1 × $6.00
Pairs Trading: Quantitative Methods and Analysis with Ganapathy Vidyamurthy
1 × $6.00 -
×
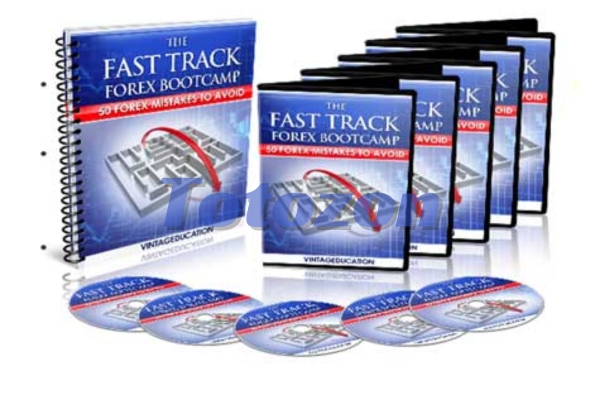 VintagEducation - The Fast Track Forex Bootcamp
1 × $6.00
VintagEducation - The Fast Track Forex Bootcamp
1 × $6.00 -
×
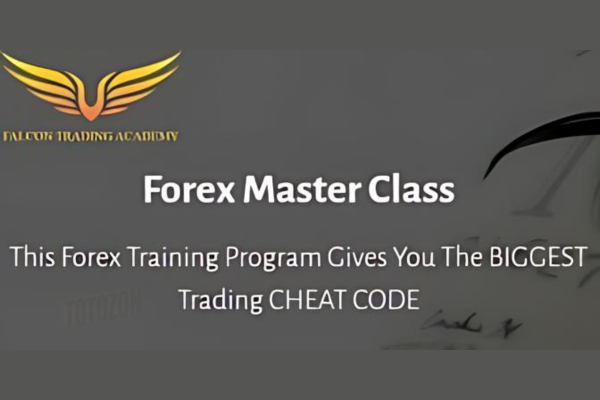 Forex Master Class with Falcon Trading Academy
1 × $5.00
Forex Master Class with Falcon Trading Academy
1 × $5.00 -
×
 The Indices Orderflow Masterclass with The Forex Scalpers
1 × $23.00
The Indices Orderflow Masterclass with The Forex Scalpers
1 × $23.00 -
×
 Forex & Fibonacci Day Trading Seminar - $695
1 × $6.00
Forex & Fibonacci Day Trading Seminar - $695
1 × $6.00 -
×
 INVESTOPEDIA - BECOME A DAY TRADER
1 × $15.00
INVESTOPEDIA - BECOME A DAY TRADER
1 × $15.00 -
×
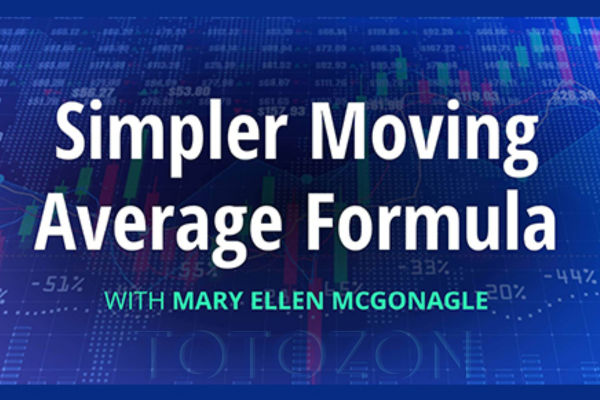 Discover the MEM Simple Moving Average Formula with Mary Ellen McGonagle
1 × $15.00
Discover the MEM Simple Moving Average Formula with Mary Ellen McGonagle
1 × $15.00 -
×
 The Precision Profit Float Indicator (TS Code & Setups) with Steve Woods
1 × $6.00
The Precision Profit Float Indicator (TS Code & Setups) with Steve Woods
1 × $6.00 -
×
 The Deadly 7 Sins of Investing with Maury Fertig
1 × $6.00
The Deadly 7 Sins of Investing with Maury Fertig
1 × $6.00 -
×
 An Ultimate Guide to Successful Investing with Trading Tuitions
1 × $23.00
An Ultimate Guide to Successful Investing with Trading Tuitions
1 × $23.00 -
×
 Risk Management Toolkit with Peter Bain
1 × $6.00
Risk Management Toolkit with Peter Bain
1 × $6.00 -
×
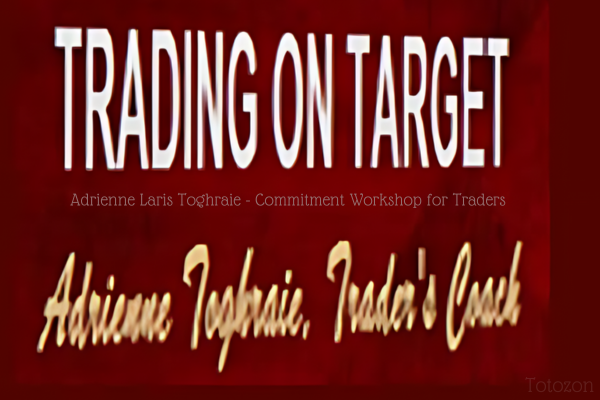 Commitment Workshop for Traders by Adrienne Laris Toghraie
1 × $6.00
Commitment Workshop for Traders by Adrienne Laris Toghraie
1 × $6.00 -
×
 Signals
1 × $6.00
Signals
1 × $6.00 -
×
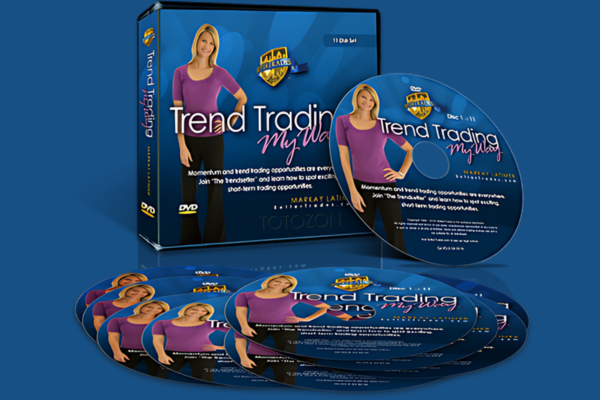 Trend Trading My Way with Markay Latimer
1 × $15.00
Trend Trading My Way with Markay Latimer
1 × $15.00 -
×
 Cryptocurrency Investing Master Class with Stone River eLearning
1 × $6.00
Cryptocurrency Investing Master Class with Stone River eLearning
1 × $6.00 -
×
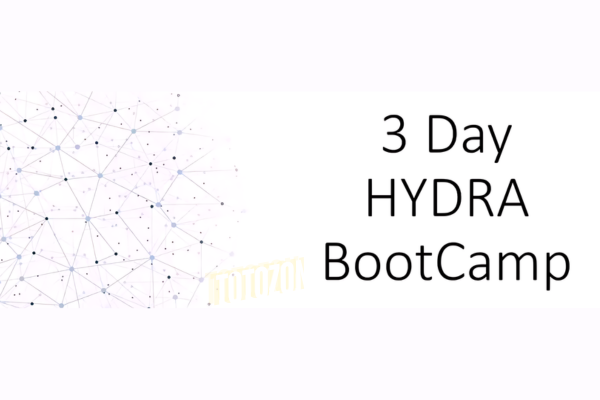 HYDRA 3 Day Bootcamp
1 × $5.00
HYDRA 3 Day Bootcamp
1 × $5.00 -
×
 Technical Analysis & Options Strategies with K.H.Shaleen
1 × $6.00
Technical Analysis & Options Strategies with K.H.Shaleen
1 × $6.00 -
×
 We Fund Traders - The Whale Order
1 × $5.00
We Fund Traders - The Whale Order
1 × $5.00 -
×
 Optimize Funding Program 2023 with Solo Network Courses
1 × $13.00
Optimize Funding Program 2023 with Solo Network Courses
1 × $13.00 -
×
 Learn Before you Loose
1 × $6.00
Learn Before you Loose
1 × $6.00 -
×
 Professional Swing Trading College with Steven Primo
1 × $15.00
Professional Swing Trading College with Steven Primo
1 × $15.00 -
×
 You Don't Need No Stinkin' Stockbroker: Taking the Pulse of Your Investment Portfolio with Doug Cappiello & Steve Tanaka
1 × $6.00
You Don't Need No Stinkin' Stockbroker: Taking the Pulse of Your Investment Portfolio with Doug Cappiello & Steve Tanaka
1 × $6.00 -
×
 Evolutionary Decision Trees for Stock Index Options and Futures Arbitrage by S.Markose, E.Tsang,H.Er
1 × $6.00
Evolutionary Decision Trees for Stock Index Options and Futures Arbitrage by S.Markose, E.Tsang,H.Er
1 × $6.00 -
×
 The Correlation Code with Jason Fielder
1 × $6.00
The Correlation Code with Jason Fielder
1 × $6.00 -
×
 Dumb Money: Adventures of a Day Trader with Joey Anuff
1 × $6.00
Dumb Money: Adventures of a Day Trader with Joey Anuff
1 × $6.00 -
×
 Proven Swing Trading Strat & Multiple Time Frame Analysis - Robert Krausz & Thom Hartle
1 × $6.00
Proven Swing Trading Strat & Multiple Time Frame Analysis - Robert Krausz & Thom Hartle
1 × $6.00 -
×
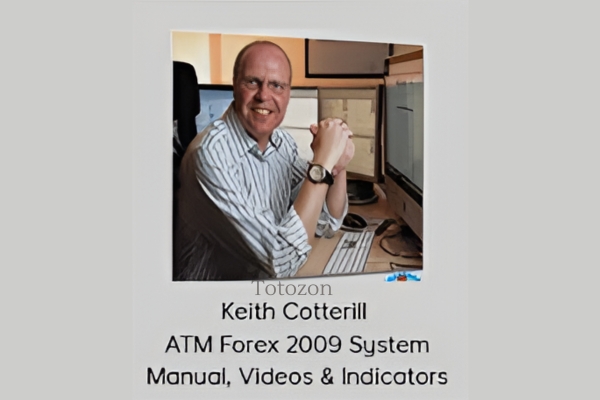 ATM Forex 2009 System Manual, Videos & Indicators with Keith Cotterill
1 × $6.00
ATM Forex 2009 System Manual, Videos & Indicators with Keith Cotterill
1 × $6.00 -
×
 MQ Gravity Lines with Base Camp Trading
1 × $54.00
MQ Gravity Lines with Base Camp Trading
1 × $54.00 -
×
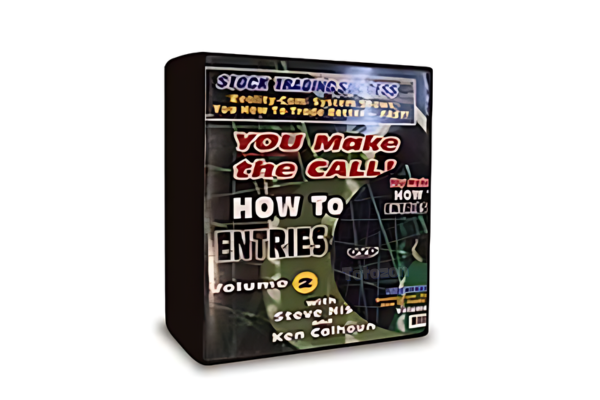 Stock Trading Success - You Make The Call - How To Set Entries And Exits with Steve Nison and K.Cal
1 × $6.00
Stock Trading Success - You Make The Call - How To Set Entries And Exits with Steve Nison and K.Cal
1 × $6.00 -
×
 Forecast 2012 Report with Larry Williams
1 × $6.00
Forecast 2012 Report with Larry Williams
1 × $6.00 -
×
 The MMXM Traders Course - The MMXM Trader
1 × $5.00
The MMXM Traders Course - The MMXM Trader
1 × $5.00 -
×
 Day Trading and Swing Trading the Currency Market with Kathy Lien
1 × $6.00
Day Trading and Swing Trading the Currency Market with Kathy Lien
1 × $6.00 -
×
 Options Trading with Nick & Gareth - Nick Santiago & Gareth Soloway - InTheMoneyStocks
1 × $31.00
Options Trading with Nick & Gareth - Nick Santiago & Gareth Soloway - InTheMoneyStocks
1 × $31.00 -
×
 Scalp Strategy and Flipping Small Accounts with Opes Trading Group
1 × $5.00
Scalp Strategy and Flipping Small Accounts with Opes Trading Group
1 × $5.00 -
×
 Order flow self-study training program with iMFtracker
1 × $10.00
Order flow self-study training program with iMFtracker
1 × $10.00 -
×
 Exploring MetaStock Basic with Martin Pring
1 × $6.00
Exploring MetaStock Basic with Martin Pring
1 × $6.00 -
×
 Vertex Investing Course
1 × $6.00
Vertex Investing Course
1 × $6.00 -
×
 Myths of the Free Market with Kenneth Friedman
1 × $6.00
Myths of the Free Market with Kenneth Friedman
1 × $6.00 -
×
 Mastering Risk Modeling with Excel by Alastair Day
1 × $6.00
Mastering Risk Modeling with Excel by Alastair Day
1 × $6.00 -
×
 Corruption and Reform: Lessons from America's Economic History with Edward Glaeser & Claudia Goldin
1 × $6.00
Corruption and Reform: Lessons from America's Economic History with Edward Glaeser & Claudia Goldin
1 × $6.00 -
×
 Master Forex Fundamentals
1 × $15.00
Master Forex Fundamentals
1 × $15.00 -
×
 Quarterly Theory with Trader Daye
1 × $20.00
Quarterly Theory with Trader Daye
1 × $20.00 -
×
 A Process for Prudential Institutional Investment with Bancroft, Caldwell, McSweeny
1 × $6.00
A Process for Prudential Institutional Investment with Bancroft, Caldwell, McSweeny
1 × $6.00 -
×
 Romeo’s University of Turtle Soup with Romeo
1 × $6.00
Romeo’s University of Turtle Soup with Romeo
1 × $6.00 -
×
 Secret Weapon to Trading Options on ETF's Class with Don Kaufman
1 × $6.00
Secret Weapon to Trading Options on ETF's Class with Don Kaufman
1 × $6.00 -
×
 Backtrade Marathon NEW with Real Life Trading
1 × $23.00
Backtrade Marathon NEW with Real Life Trading
1 × $23.00 -
×
 James Dalton Mind Over Markets Expanded Intensive Series 2018
1 × $6.00
James Dalton Mind Over Markets Expanded Intensive Series 2018
1 × $6.00 -
×
 Seller Specialist Program with Chris Prefontaine
1 × $62.00
Seller Specialist Program with Chris Prefontaine
1 × $62.00 -
×
 Mars Vesta Cycle in Stocks Markets (Article) with Bill Meridian
1 × $6.00
Mars Vesta Cycle in Stocks Markets (Article) with Bill Meridian
1 × $6.00 -
×
 Support and Resistance Trading with Rob Booker
1 × $6.00
Support and Resistance Trading with Rob Booker
1 × $6.00 -
×
 Forex Strategies Course For Weekly Charts with Cory Mitchell - Vantage Point Trading
1 × $4.00
Forex Strategies Course For Weekly Charts with Cory Mitchell - Vantage Point Trading
1 × $4.00 -
×
 How to Call the Top in a Stock (To the Penny!) and Earn 9-11% Annualized Cash Yields Doing It with Dan Ferris
1 × $6.00
How to Call the Top in a Stock (To the Penny!) and Earn 9-11% Annualized Cash Yields Doing It with Dan Ferris
1 × $6.00 -
×
 New Market Mavericks with Geoff Cutmore
1 × $6.00
New Market Mavericks with Geoff Cutmore
1 × $6.00 -
×
 Art & Science of Trend Trading Class with Jeff Bierman
1 × $6.00
Art & Science of Trend Trading Class with Jeff Bierman
1 × $6.00 -
×
 ETF Trend Trading Mentorship Course
1 × $15.00
ETF Trend Trading Mentorship Course
1 × $15.00 -
×
 Fierce 10 On Demand Coaching Program with High Performance Trading
1 × $5.00
Fierce 10 On Demand Coaching Program with High Performance Trading
1 × $5.00 -
×
 Trading Short TermSame Day Trades Sep 2023 with Dan Sheridan & Mark Fenton - Sheridan Options Mentoring
1 × $31.00
Trading Short TermSame Day Trades Sep 2023 with Dan Sheridan & Mark Fenton - Sheridan Options Mentoring
1 × $31.00

Reading & Understanding Charts with Andrew Baxter
$6.00
File Size: 311MB
Delivery Time: 1–12 hours
Media Type: Online Course
Content Proof: Watch Here!
You may check content proof of “Reading & Understanding Chartsb with Andrew Baxter” below:

Reading & Understanding Charts with Andrew Baxter
Introduction to Chart Reading
Charts are essential tools for traders, providing visual representations of market data. Andrew Baxter, a renowned trader and educator, shares his expertise on how to read and understand charts effectively. This article will guide you through the basics and advanced techniques of chart reading, helping you make informed trading decisions.
What are Trading Charts?
Definition and Purpose
Trading charts are graphical representations of price movements over time. They help traders analyze trends, identify patterns, and make predictions about future price movements.
Importance of Chart Reading
Understanding charts is crucial for making data-driven decisions in trading. It reduces emotional trading and enhances your ability to spot opportunities and risks.
Types of Trading Charts
1. Line Charts
Line charts are the simplest form of trading charts, showing the closing prices over a period. They provide a clear view of the overall trend but lack detailed information.
2. Bar Charts
Bar charts display the opening, closing, high, and low prices for each period. They offer more information than line charts and help in understanding price volatility.
3. Candlestick Charts
Candlestick charts are popular due to their detailed and visually appealing format. Each candlestick shows the opening, closing, high, and low prices, making it easier to identify market sentiment.
Understanding Candlestick Charts
Components of a Candlestick
- Body: The filled part showing the opening and closing prices.
- Wicks/Shadows: The thin lines representing the high and low prices.
- Color: Indicates whether the closing price was higher (typically green) or lower (typically red) than the opening price.
Common Candlestick Patterns
1. Doji
A Doji occurs when the opening and closing prices are nearly the same, indicating indecision in the market.
2. Hammer
A Hammer has a small body with a long lower wick, suggesting a potential reversal from a downtrend.
3. Engulfing Pattern
An Engulfing pattern occurs when a larger candlestick completely engulfs the previous smaller candlestick, signaling a potential reversal.
Key Chart Patterns
1. Head and Shoulders
This pattern indicates a reversal and is formed by a peak (head) flanked by two smaller peaks (shoulders).
2. Double Top and Double Bottom
These patterns signal a potential reversal. A double top indicates a bearish reversal, while a double bottom suggests a bullish reversal.
3. Triangles
Triangles are continuation patterns that show a period of consolidation before the price continues in the direction of the previous trend.
Using Technical Indicators
1. Moving Averages
Moving averages smooth out price data to identify trends. Common types include Simple Moving Average (SMA) and Exponential Moving Average (EMA).
2. Relative Strength Index (RSI)
RSI measures the speed and change of price movements, indicating overbought or oversold conditions.
3. Moving Average Convergence Divergence (MACD)
MACD shows the relationship between two moving averages, helping to identify potential buy and sell signals.
Combining Chart Patterns and Indicators
Integrated Analysis
Combining chart patterns with technical indicators enhances the reliability of trading signals. For example, confirming a head and shoulders pattern with RSI divergence can provide a stronger signal.
Practical Application
Use a combination of patterns and indicators to develop a comprehensive trading strategy. This approach helps in making more informed and confident trading decisions.
Advanced Chart Reading Techniques
1. Fibonacci Retracement
Fibonacci retracement levels indicate potential support and resistance levels based on the Fibonacci sequence.
2. Volume Analysis
Volume analysis involves examining the number of shares traded to confirm the strength of a price movement or trend.
3. Divergence
Divergence occurs when the price moves in the opposite direction of an indicator, signaling a potential reversal.
Common Mistakes in Chart Reading
1. Overcomplicating Analysis
Avoid using too many indicators and patterns at once. Focus on a few reliable tools to keep your analysis clear and effective.
2. Ignoring Context
Always consider the broader market context and economic factors. Relying solely on charts without context can lead to misleading conclusions.
3. Emotional Trading
Stick to your analysis and avoid making decisions based on emotions. Emotional trading can undermine even the best chart reading skills.
Benefits of Mastering Chart Reading
1. Improved Decision Making
Accurate chart reading helps you make informed decisions, reducing the risk of losses and increasing the potential for gains.
2. Enhanced Trading Strategy
Understanding charts allows you to develop and refine your trading strategies, making them more effective and adaptable.
3. Increased Confidence
With better chart reading skills, you gain confidence in your trading decisions, leading to more consistent performance.
Conclusion
Reading and understanding charts with insights from Andrew Baxter can significantly improve your trading performance. By mastering various chart types, patterns, and technical indicators, you can make more informed decisions and develop robust trading strategies. Embrace these principles, continuously practice, and refine your skills to become a proficient trader.
Frequently Asked Questions:
What are the main types of trading charts?
The main types are line charts, bar charts, and candlestick charts.
Why are candlestick charts popular?
Candlestick charts are popular due to their detailed and visually appealing format, making it easier to identify market sentiment.
What are some common candlestick patterns?
Common patterns include Doji, Hammer, and Engulfing patterns.
How can technical indicators enhance chart reading?
Technical indicators like moving averages, RSI, and MACD help identify trends, momentum, and potential buy/sell signals.
What are some advanced chart reading techniques?
Advanced techniques include Fibonacci retracement, volume analysis, and divergence.
Be the first to review “Reading & Understanding Charts with Andrew Baxter”
You must be logged in to post a review.
Related products
Original price was: $999.00.$5.00Current price is: $5.00.

Original price was: $1,849.00.$15.00Current price is: $15.00.

Forex Trading
Quantamentals – The Next Great Forefront Of Trading and Investing with Trading Markets
Original price was: $1,495.00.$8.00Current price is: $8.00.

Original price was: $1,200.00.$23.00Current price is: $23.00.

Forex Trading
Original price was: $1,098.00.$39.00Current price is: $39.00.

Forex Trading
Original price was: $2,995.00.$31.00Current price is: $31.00.

Original price was: $695.00.$41.00Current price is: $41.00.

Forex Trading
Original price was: $249.00.$15.00Current price is: $15.00.
Forex Trading
Original price was: $499.00.$15.00Current price is: $15.00.

Forex Trading
Original price was: $550.00.$5.00Current price is: $5.00.

Forex Trading
Original price was: $799.00.$15.00Current price is: $15.00.

Original price was: $895.00.$15.00Current price is: $15.00.

Original price was: $497.00.$11.00Current price is: $11.00.

Forex Trading
Original price was: $2,997.00.$23.00Current price is: $23.00.

Forex Trading
Original price was: $697.00.$5.00Current price is: $5.00.

Original price was: $2,120.00.$15.00Current price is: $15.00.

Original price was: $649.00.$20.00Current price is: $20.00.

Original price was: $4,995.00.$15.00Current price is: $15.00.
Original price was: $450.00.$23.00Current price is: $23.00.
Forex Trading
Original price was: $397.00.$31.00Current price is: $31.00.

Reviews
There are no reviews yet.