-
×
 Harnessing Explosive Market Turns - 3 DVD with Jeff Greenblatt
1 × $6.00
Harnessing Explosive Market Turns - 3 DVD with Jeff Greenblatt
1 × $6.00 -
×
 Starter Guide to Investing Stocks, Crypto & Precious Metals with Ryan Hogue
1 × $5.00
Starter Guide to Investing Stocks, Crypto & Precious Metals with Ryan Hogue
1 × $5.00 -
×
 Rob’s 6 Day 21 Set-up Course with Rob Hoffman
1 × $85.00
Rob’s 6 Day 21 Set-up Course with Rob Hoffman
1 × $85.00 -
×
 Technical Indicators that Really Work with M.Larson
1 × $6.00
Technical Indicators that Really Work with M.Larson
1 × $6.00 -
×
 MAP. Moving Average Patterns CD with David Elliott
1 × $6.00
MAP. Moving Average Patterns CD with David Elliott
1 × $6.00 -
×
 Zero to Hero Course with EVO Capital
1 × $13.00
Zero to Hero Course with EVO Capital
1 × $13.00 -
×
 The Stock Market Trading Secrets of the Late (1940, scaned)
1 × $6.00
The Stock Market Trading Secrets of the Late (1940, scaned)
1 × $6.00 -
×
 Weekly Iron Condors For Income with Bruce Wayne
1 × $6.00
Weekly Iron Condors For Income with Bruce Wayne
1 × $6.00 -
×
 Money Miracle: Use Other Peoples Money to Make You Rich with George Angell
1 × $6.00
Money Miracle: Use Other Peoples Money to Make You Rich with George Angell
1 × $6.00 -
×
 Market Making Scalping Manual with Gary Norden - Jigsaw Trading
1 × $69.00
Market Making Scalping Manual with Gary Norden - Jigsaw Trading
1 × $69.00 -
×
 Scientific Trading Machine with Nicola Delic
1 × $54.00
Scientific Trading Machine with Nicola Delic
1 × $54.00 -
×
 Discounted Cash Flow Valuation: Spot Undervalued Stocks Fast with Jari Roomer
1 × $6.00
Discounted Cash Flow Valuation: Spot Undervalued Stocks Fast with Jari Roomer
1 × $6.00 -
×
 Advanced Breakthroughs in Day Trading DVD course with George Angell
1 × $6.00
Advanced Breakthroughs in Day Trading DVD course with George Angell
1 × $6.00 -
×
 Traders Seminars – 7 CD
1 × $31.00
Traders Seminars – 7 CD
1 × $31.00 -
×
 Confessions of a Pit Trader 2003 with Rick Burgess
1 × $6.00
Confessions of a Pit Trader 2003 with Rick Burgess
1 × $6.00 -
×
 Tradeguider Mentorship Collection
1 × $54.00
Tradeguider Mentorship Collection
1 × $54.00 -
×
 The Stock Market, Credit & Capital Formation with Fritz Machlup
1 × $6.00
The Stock Market, Credit & Capital Formation with Fritz Machlup
1 × $6.00 -
×
 Forex Profit Multiplier with Bill & Greg Poulos
1 × $6.00
Forex Profit Multiplier with Bill & Greg Poulos
1 × $6.00 -
×
 Oportunities in Forex Calendar Trading Patterns with Anduril Analytics
1 × $6.00
Oportunities in Forex Calendar Trading Patterns with Anduril Analytics
1 × $6.00 -
×
 Option Strategies with Courtney Smith
1 × $6.00
Option Strategies with Courtney Smith
1 × $6.00 -
×
 Electronic AGS Trading Workshop with John Carter & Hunert Senters
1 × $6.00
Electronic AGS Trading Workshop with John Carter & Hunert Senters
1 × $6.00 -
×
 My Forex League - The Course
1 × $5.00
My Forex League - The Course
1 × $5.00 -
×
 SOT Intermediate Course (May 2014)
1 × $23.00
SOT Intermediate Course (May 2014)
1 × $23.00 -
×
 FXS Analytics Training and Q&A Access with FXS Analytics
1 × $6.00
FXS Analytics Training and Q&A Access with FXS Analytics
1 × $6.00 -
×
 Full Members Area (Icludes 2006 Seminar & Webinars) with Tom Yeomans
1 × $6.00
Full Members Area (Icludes 2006 Seminar & Webinars) with Tom Yeomans
1 × $6.00 -
×
 The Orderflows Trade Opportunities Encyclopedia with Michael Valtos
1 × $8.00
The Orderflows Trade Opportunities Encyclopedia with Michael Valtos
1 × $8.00 -
×
 Pro Indicator Pack with Trade Confident
1 × $15.00
Pro Indicator Pack with Trade Confident
1 × $15.00 -
×
 Quantamentals - The Next Great Forefront Of Trading and Investing with Trading Markets
1 × $8.00
Quantamentals - The Next Great Forefront Of Trading and Investing with Trading Markets
1 × $8.00 -
×
 VXX Made Easy By Option Pit
1 × $62.00
VXX Made Easy By Option Pit
1 × $62.00 -
×
 Pocketing Premium Master Class (Basic) with Henrry Gambell
1 × $31.00
Pocketing Premium Master Class (Basic) with Henrry Gambell
1 × $31.00 -
×
 Breakthroughs in Technical Analysis: New Thinking From the World's Top Minds (1st Edition) with David Keller
1 × $6.00
Breakthroughs in Technical Analysis: New Thinking From the World's Top Minds (1st Edition) with David Keller
1 × $6.00 -
×
 Paradox Forex Course
1 × $5.00
Paradox Forex Course
1 × $5.00 -
×
 Levines Guide to Spss for Analysis of Variance with Melanie Page, Sanford Braver & David Mackinnon
1 × $6.00
Levines Guide to Spss for Analysis of Variance with Melanie Page, Sanford Braver & David Mackinnon
1 × $6.00 -
×
 WYCKOFF TRADING COURSE (WTC) PART I – ANALYSIS (Fall 2021) with Roman Bogomazov
1 × $209.00
WYCKOFF TRADING COURSE (WTC) PART I – ANALYSIS (Fall 2021) with Roman Bogomazov
1 × $209.00 -
×
 Real Trade Examples Volume 1 with Steve Burns
1 × $15.00
Real Trade Examples Volume 1 with Steve Burns
1 × $15.00 -
×
 Footprint Day Trading Blueprint with Futures Flow
1 × $5.00
Footprint Day Trading Blueprint with Futures Flow
1 × $5.00 -
×
 Prasna Tantra. Horary Astrology with Bangalore Venkata Raman
1 × $6.00
Prasna Tantra. Horary Astrology with Bangalore Venkata Raman
1 × $6.00 -
×
 Option Alpha Signals
1 × $15.00
Option Alpha Signals
1 × $15.00 -
×
 The STRAT Execution Basics with Jermaine McGruder
1 × $31.00
The STRAT Execution Basics with Jermaine McGruder
1 × $31.00 -
×
 Forecast 2024 Clarification with Larry Williams
1 × $15.00
Forecast 2024 Clarification with Larry Williams
1 × $15.00 -
×
 MATS Market Auction Trading System with Ryan Watts
1 × $6.00
MATS Market Auction Trading System with Ryan Watts
1 × $6.00 -
×
 Volatility and Timing with Jay Kaeppel – The Option Trader’s Guide to Probability
1 × $6.00
Volatility and Timing with Jay Kaeppel – The Option Trader’s Guide to Probability
1 × $6.00 -
×
 Main Online Course with Cue Banks
1 × $90.00
Main Online Course with Cue Banks
1 × $90.00 -
×
 Basecamptrading - Naked Trading Part 2
1 × $6.00
Basecamptrading - Naked Trading Part 2
1 × $6.00 -
×
 Trading For Busy People with Josias Kere
1 × $6.00
Trading For Busy People with Josias Kere
1 × $6.00 -
×
 Kicker Signals with Stephen W.Bigalow
1 × $6.00
Kicker Signals with Stephen W.Bigalow
1 × $6.00 -
×
 The City Traders Course with Andrew Lockwood
1 × $10.00
The City Traders Course with Andrew Lockwood
1 × $10.00 -
×
 Cyzners Trading Journal (Algo Trading)
1 × $5.00
Cyzners Trading Journal (Algo Trading)
1 × $5.00 -
×
 Survive and Thrive in Extreme Volatility Class with Don Kaufman
1 × $6.00
Survive and Thrive in Extreme Volatility Class with Don Kaufman
1 × $6.00 -
×
 Simpler Options - Stock Trading Patterns
1 × $6.00
Simpler Options - Stock Trading Patterns
1 × $6.00 -
×
 Road Map to Riches with Steve Wirrick
1 × $6.00
Road Map to Riches with Steve Wirrick
1 × $6.00 -
×
 MambaFX - Bundle - Trading/Scalping
1 × $23.00
MambaFX - Bundle - Trading/Scalping
1 × $23.00 -
×
 The Loyalty Effect with Frederick Reichheld
1 × $6.00
The Loyalty Effect with Frederick Reichheld
1 × $6.00 -
×
 3 Short Selling Strategies - Trading Strategy Bundles – Quantified Strategies
1 × $39.00
3 Short Selling Strategies - Trading Strategy Bundles – Quantified Strategies
1 × $39.00 -
×
 June 2010 Training Video
1 × $6.00
June 2010 Training Video
1 × $6.00 -
×
 Fractal Energy Trading with Doc Severson
1 × $6.00
Fractal Energy Trading with Doc Severson
1 × $6.00 -
×
 Mastering Fundamental Analysis with Michael Thomsett
1 × $6.00
Mastering Fundamental Analysis with Michael Thomsett
1 × $6.00 -
×
 Guide to Winning with Automated Trading Systems with Jack Schwager
1 × $6.00
Guide to Winning with Automated Trading Systems with Jack Schwager
1 × $6.00 -
×
 The Three Secrets to Trading Momentum Indicators with David Penn
1 × $6.00
The Three Secrets to Trading Momentum Indicators with David Penn
1 × $6.00 -
×
 Trading Secrets of the Inner Circle with Andrew Goodwin
1 × $6.00
Trading Secrets of the Inner Circle with Andrew Goodwin
1 × $6.00 -
×
 Investment Illusions with Martin S.Fridson
1 × $6.00
Investment Illusions with Martin S.Fridson
1 × $6.00 -
×
 Scalping Master Course with Dayonetraders
1 × $6.00
Scalping Master Course with Dayonetraders
1 × $6.00 -
×
 Original Charting 1936 with W.D.Gann
1 × $6.00
Original Charting 1936 with W.D.Gann
1 × $6.00 -
×
 Crystal Ball Pack PLUS bonus Live Trade By Pat Mitchell - Trick Trades
1 × $20.00
Crystal Ball Pack PLUS bonus Live Trade By Pat Mitchell - Trick Trades
1 × $20.00 -
×
 Advanced Ichimoku Kinkō Hyō - Ichimoku Cloud Strategy with Rafał Zuchowicz - TopMasterTrader
1 × $17.00
Advanced Ichimoku Kinkō Hyō - Ichimoku Cloud Strategy with Rafał Zuchowicz - TopMasterTrader
1 × $17.00 -
×
 Trade Options Like a DPM with The Admiral Webinar Series with Hamzei Analytics
1 × $6.00
Trade Options Like a DPM with The Admiral Webinar Series with Hamzei Analytics
1 × $6.00 -
×
 Gann’s Secret with Jeanne Long
1 × $4.00
Gann’s Secret with Jeanne Long
1 × $4.00 -
×
 Forex Master Method Evolution with Russ Horn
1 × $6.00
Forex Master Method Evolution with Russ Horn
1 × $6.00 -
×
 SOT Advanced Course (May 2014)
1 × $23.00
SOT Advanced Course (May 2014)
1 × $23.00 -
×
 The Volatility Course Workbook: Step-by-Step Exercises to Help You Master The Volatility Course - George Fontanills & Tom Gentile
1 × $6.00
The Volatility Course Workbook: Step-by-Step Exercises to Help You Master The Volatility Course - George Fontanills & Tom Gentile
1 × $6.00 -
×
 Joshua ICT ChartLab 2023
1 × $5.00
Joshua ICT ChartLab 2023
1 × $5.00 -
×
 MTI - Trend Trader Course (Feb 2014)
1 × $23.00
MTI - Trend Trader Course (Feb 2014)
1 × $23.00 -
×
 Electronic Trading "TNT" III Technical Trading Stuff with Joe Ross & Mark Cherlin
1 × $6.00
Electronic Trading "TNT" III Technical Trading Stuff with Joe Ross & Mark Cherlin
1 × $6.00 -
×
 Master Bundle with Gemify Academy
1 × $5.00
Master Bundle with Gemify Academy
1 × $5.00 -
×
 Asset Markets, Portfolio Choice and Macroeconomic Activity: A Keynesian Perspective - Toichiro Asadra, Peter Flaschel, Tarik Mouakil & Christian Proaño
1 × $6.00
Asset Markets, Portfolio Choice and Macroeconomic Activity: A Keynesian Perspective - Toichiro Asadra, Peter Flaschel, Tarik Mouakil & Christian Proaño
1 × $6.00 -
×
 CM APR (A Pivot Reverse) Trade Method with Austin Passamonte
1 × $6.00
CM APR (A Pivot Reverse) Trade Method with Austin Passamonte
1 × $6.00 -
×
 Fixed-Income Securities: Valuation, Risk Management and Portfolio Strategies - Lionel Martellini, Philippe Priaulet & Stéphane Priaulet
1 × $6.00
Fixed-Income Securities: Valuation, Risk Management and Portfolio Strategies - Lionel Martellini, Philippe Priaulet & Stéphane Priaulet
1 × $6.00 -
×
 Trading NQ At The US Open with TradeSmart
1 × $10.00
Trading NQ At The US Open with TradeSmart
1 × $10.00 -
×
 Virtual Intensive Trader Training
1 × $31.00
Virtual Intensive Trader Training
1 × $31.00 -
×
 Getting Started in Forex Trading Strategies with Michael Duane Archer
1 × $6.00
Getting Started in Forex Trading Strategies with Michael Duane Archer
1 × $6.00 -
×
 Ez-Forex Trading System 4.2 with Beau Diamond
1 × $6.00
Ez-Forex Trading System 4.2 with Beau Diamond
1 × $6.00 -
×
 Foundations of Technical Analysis (Article) with Andrew W.Lo
1 × $6.00
Foundations of Technical Analysis (Article) with Andrew W.Lo
1 × $6.00 -
×
 Zm Capitals Full course + Ebook with Zain Mokhles - ZmCapitals
1 × $31.00
Zm Capitals Full course + Ebook with Zain Mokhles - ZmCapitals
1 × $31.00 -
×
 Simpler Options - Insider’s Guide to Generating Income using Options Strategies Course (Oct 2014)
1 × $6.00
Simpler Options - Insider’s Guide to Generating Income using Options Strategies Course (Oct 2014)
1 × $6.00 -
×
 Galactic Trader Seminar
1 × $15.00
Galactic Trader Seminar
1 × $15.00 -
×
 How to Trade Options 101 2021 with The Travel Trader
1 × $54.00
How to Trade Options 101 2021 with The Travel Trader
1 × $54.00 -
×
 The BFI Trading Course
1 × $6.00
The BFI Trading Course
1 × $6.00 -
×
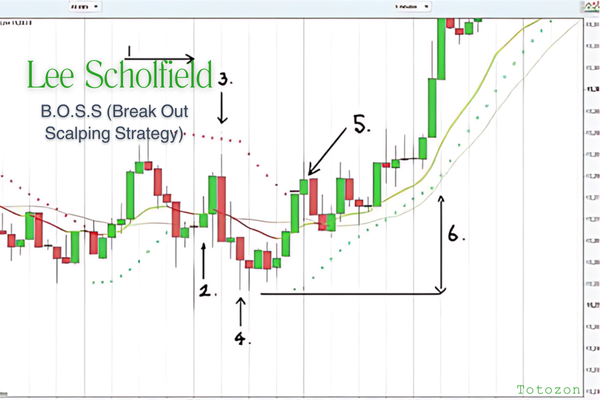 B.O.S.S (Break Out Scalping Strategy) with Lee Scholfield
1 × $6.00
B.O.S.S (Break Out Scalping Strategy) with Lee Scholfield
1 × $6.00 -
×
 Superleverage The Only Sensible Way to Speculate with Steve Sarnoff
1 × $6.00
Superleverage The Only Sensible Way to Speculate with Steve Sarnoff
1 × $6.00 -
×
 Executive Mentoring Elliot Wave Course (Video & Manuals)
1 × $6.00
Executive Mentoring Elliot Wave Course (Video & Manuals)
1 × $6.00 -
×
 AnkhFX Academy Course
1 × $17.00
AnkhFX Academy Course
1 × $17.00 -
×
 Forecasting Profits Using Price & Time with Ed Gately
1 × $6.00
Forecasting Profits Using Price & Time with Ed Gately
1 × $6.00 -
×
 Chart Reading Course with TraderSumo
1 × $5.00
Chart Reading Course with TraderSumo
1 × $5.00 -
×
 Scalp Strategy and Flipping Small Accounts with Opes Trading Group
1 × $5.00
Scalp Strategy and Flipping Small Accounts with Opes Trading Group
1 × $5.00

Reading & Understanding Charts with Andrew Baxter
$6.00
File Size: 311MB
Delivery Time: 1–12 hours
Media Type: Online Course
Content Proof: Watch Here!
You may check content proof of “Reading & Understanding Chartsb with Andrew Baxter” below:

Reading & Understanding Charts with Andrew Baxter
Introduction to Chart Reading
Charts are essential tools for traders, providing visual representations of market data. Andrew Baxter, a renowned trader and educator, shares his expertise on how to read and understand charts effectively. This article will guide you through the basics and advanced techniques of chart reading, helping you make informed trading decisions.
What are Trading Charts?
Definition and Purpose
Trading charts are graphical representations of price movements over time. They help traders analyze trends, identify patterns, and make predictions about future price movements.
Importance of Chart Reading
Understanding charts is crucial for making data-driven decisions in trading. It reduces emotional trading and enhances your ability to spot opportunities and risks.
Types of Trading Charts
1. Line Charts
Line charts are the simplest form of trading charts, showing the closing prices over a period. They provide a clear view of the overall trend but lack detailed information.
2. Bar Charts
Bar charts display the opening, closing, high, and low prices for each period. They offer more information than line charts and help in understanding price volatility.
3. Candlestick Charts
Candlestick charts are popular due to their detailed and visually appealing format. Each candlestick shows the opening, closing, high, and low prices, making it easier to identify market sentiment.
Understanding Candlestick Charts
Components of a Candlestick
- Body: The filled part showing the opening and closing prices.
- Wicks/Shadows: The thin lines representing the high and low prices.
- Color: Indicates whether the closing price was higher (typically green) or lower (typically red) than the opening price.
Common Candlestick Patterns
1. Doji
A Doji occurs when the opening and closing prices are nearly the same, indicating indecision in the market.
2. Hammer
A Hammer has a small body with a long lower wick, suggesting a potential reversal from a downtrend.
3. Engulfing Pattern
An Engulfing pattern occurs when a larger candlestick completely engulfs the previous smaller candlestick, signaling a potential reversal.
Key Chart Patterns
1. Head and Shoulders
This pattern indicates a reversal and is formed by a peak (head) flanked by two smaller peaks (shoulders).
2. Double Top and Double Bottom
These patterns signal a potential reversal. A double top indicates a bearish reversal, while a double bottom suggests a bullish reversal.
3. Triangles
Triangles are continuation patterns that show a period of consolidation before the price continues in the direction of the previous trend.
Using Technical Indicators
1. Moving Averages
Moving averages smooth out price data to identify trends. Common types include Simple Moving Average (SMA) and Exponential Moving Average (EMA).
2. Relative Strength Index (RSI)
RSI measures the speed and change of price movements, indicating overbought or oversold conditions.
3. Moving Average Convergence Divergence (MACD)
MACD shows the relationship between two moving averages, helping to identify potential buy and sell signals.
Combining Chart Patterns and Indicators
Integrated Analysis
Combining chart patterns with technical indicators enhances the reliability of trading signals. For example, confirming a head and shoulders pattern with RSI divergence can provide a stronger signal.
Practical Application
Use a combination of patterns and indicators to develop a comprehensive trading strategy. This approach helps in making more informed and confident trading decisions.
Advanced Chart Reading Techniques
1. Fibonacci Retracement
Fibonacci retracement levels indicate potential support and resistance levels based on the Fibonacci sequence.
2. Volume Analysis
Volume analysis involves examining the number of shares traded to confirm the strength of a price movement or trend.
3. Divergence
Divergence occurs when the price moves in the opposite direction of an indicator, signaling a potential reversal.
Common Mistakes in Chart Reading
1. Overcomplicating Analysis
Avoid using too many indicators and patterns at once. Focus on a few reliable tools to keep your analysis clear and effective.
2. Ignoring Context
Always consider the broader market context and economic factors. Relying solely on charts without context can lead to misleading conclusions.
3. Emotional Trading
Stick to your analysis and avoid making decisions based on emotions. Emotional trading can undermine even the best chart reading skills.
Benefits of Mastering Chart Reading
1. Improved Decision Making
Accurate chart reading helps you make informed decisions, reducing the risk of losses and increasing the potential for gains.
2. Enhanced Trading Strategy
Understanding charts allows you to develop and refine your trading strategies, making them more effective and adaptable.
3. Increased Confidence
With better chart reading skills, you gain confidence in your trading decisions, leading to more consistent performance.
Conclusion
Reading and understanding charts with insights from Andrew Baxter can significantly improve your trading performance. By mastering various chart types, patterns, and technical indicators, you can make more informed decisions and develop robust trading strategies. Embrace these principles, continuously practice, and refine your skills to become a proficient trader.
Frequently Asked Questions:
What are the main types of trading charts?
The main types are line charts, bar charts, and candlestick charts.
Why are candlestick charts popular?
Candlestick charts are popular due to their detailed and visually appealing format, making it easier to identify market sentiment.
What are some common candlestick patterns?
Common patterns include Doji, Hammer, and Engulfing patterns.
How can technical indicators enhance chart reading?
Technical indicators like moving averages, RSI, and MACD help identify trends, momentum, and potential buy/sell signals.
What are some advanced chart reading techniques?
Advanced techniques include Fibonacci retracement, volume analysis, and divergence.
Be the first to review “Reading & Understanding Charts with Andrew Baxter”
You must be logged in to post a review.
Related products

Forex Trading
Original price was: $850.00.$23.00Current price is: $23.00.

Forex Trading
Original price was: $799.00.$15.00Current price is: $15.00.

Original price was: $310.00.$23.00Current price is: $23.00.

Original price was: $139.00.$23.00Current price is: $23.00.

Forex Trading
Original price was: $397.00.$31.00Current price is: $31.00.

Original price was: $1,849.00.$15.00Current price is: $15.00.

Forex Trading
Original price was: $2,995.00.$31.00Current price is: $31.00.

Original price was: $695.00.$41.00Current price is: $41.00.

Forex Trading
Original price was: $239.00.$8.00Current price is: $8.00.

Forex Trading
Original price was: $2,997.00.$23.00Current price is: $23.00.

Forex Trading
Original price was: $499.00.$15.00Current price is: $15.00.

Original price was: $997.00.$8.00Current price is: $8.00.

Original price was: $2,120.00.$15.00Current price is: $15.00.

Forex Trading
Original price was: $500.00.$5.00Current price is: $5.00.

Original price was: $1,800.00.$54.00Current price is: $54.00.

Original price was: $799.00.$15.00Current price is: $15.00.

Original price was: $497.00.$11.00Current price is: $11.00.

Forex Trading
Original price was: $1,098.00.$39.00Current price is: $39.00.

Forex Trading
Original price was: $999.00.$15.00Current price is: $15.00.

Original price was: $700.00.$39.00Current price is: $39.00.

Reviews
There are no reviews yet.