-
×
 Redler Ultimate Access
1 × $54.00
Redler Ultimate Access
1 × $54.00 -
×
 W. D Gann 's Square Of 9 Applied To Modern Markets with Sean Avidar - Hexatrade350
1 × $23.00
W. D Gann 's Square Of 9 Applied To Modern Markets with Sean Avidar - Hexatrade350
1 × $23.00 -
×
 Trading Secrets of the Inner Circle with Andrew Goodwin
1 × $6.00
Trading Secrets of the Inner Circle with Andrew Goodwin
1 × $6.00 -
×
 Level II Profit System with Sammy Chua
1 × $6.00
Level II Profit System with Sammy Chua
1 × $6.00 -
×
 Levelator Automatic Trading Machines-Russ Horn’s
1 × $23.00
Levelator Automatic Trading Machines-Russ Horn’s
1 × $23.00 -
×
 The Dark Side Of Valuation with Aswath Damodaran
1 × $6.00
The Dark Side Of Valuation with Aswath Damodaran
1 × $6.00 -
×
 USDX Trading Course with Jared Martinez - MTI
1 × $6.00
USDX Trading Course with Jared Martinez - MTI
1 × $6.00 -
×
 Pro Trading Blueprint with Limitless Forex Academy
1 × $5.00
Pro Trading Blueprint with Limitless Forex Academy
1 × $5.00 -
×
 Cluster Delta with Gova Trading Academy
1 × $5.00
Cluster Delta with Gova Trading Academy
1 × $5.00 -
×
 Options Wizardry from A to Z (Video 2.80 GB) with Don Fishback
1 × $6.00
Options Wizardry from A to Z (Video 2.80 GB) with Don Fishback
1 × $6.00 -
×
 Secrets of Great Investors (Audio Book 471 MB) with Louis Rukeyser
1 × $6.00
Secrets of Great Investors (Audio Book 471 MB) with Louis Rukeyser
1 × $6.00 -
×
 MTA - Technically Speaking Newsletters
1 × $6.00
MTA - Technically Speaking Newsletters
1 × $6.00 -
×
 Play to Win with David La Piana & Michaela Hayes
1 × $6.00
Play to Win with David La Piana & Michaela Hayes
1 × $6.00 -
×
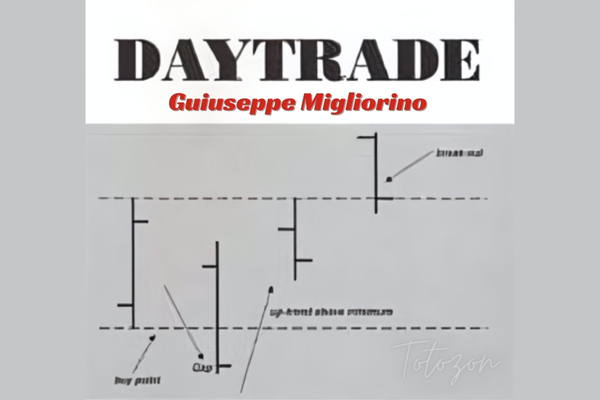 Daytrade (Italian) with Guiuseppe Migliorino
1 × $6.00
Daytrade (Italian) with Guiuseppe Migliorino
1 × $6.00 -
×
 Credit Spread Trading Made Simple 3.0
1 × $6.00
Credit Spread Trading Made Simple 3.0
1 × $6.00 -
×
 High Probability Trading Using Elliott Wave And Fibonacci Analysis withVic Patel - Forex Training Group
1 × $10.00
High Probability Trading Using Elliott Wave And Fibonacci Analysis withVic Patel - Forex Training Group
1 × $10.00 -
×
 How I Make A Living Daytrading Stocks with David Floyd
1 × $4.00
How I Make A Living Daytrading Stocks with David Floyd
1 × $4.00 -
×
 How You Can Identify Turning Points Using Fibonacci
1 × $6.00
How You Can Identify Turning Points Using Fibonacci
1 × $6.00 -
×
 3 Steps To Supply/Demand + 3 Steps To Market Profile 10% Off Combined Price
1 × $23.00
3 Steps To Supply/Demand + 3 Steps To Market Profile 10% Off Combined Price
1 × $23.00 -
×
 Full 2 Day Dark Pool And Market Strategy Training
1 × $6.00
Full 2 Day Dark Pool And Market Strategy Training
1 × $6.00 -
×
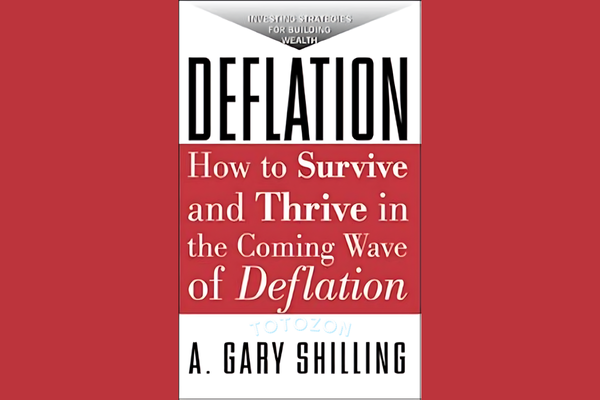 Deflaction with A.Gary Shilling
1 × $6.00
Deflaction with A.Gary Shilling
1 × $6.00 -
×
 Rockwell Trading - Can You Make A Living Day Trading - 2 DVD
1 × $6.00
Rockwell Trading - Can You Make A Living Day Trading - 2 DVD
1 × $6.00 -
×
 Forex 800k Workshop with Spartan Trader
1 × $23.00
Forex 800k Workshop with Spartan Trader
1 × $23.00 -
×
 You Don't Need No Stinkin' Stockbroker: Taking the Pulse of Your Investment Portfolio with Doug Cappiello & Steve Tanaka
1 × $6.00
You Don't Need No Stinkin' Stockbroker: Taking the Pulse of Your Investment Portfolio with Doug Cappiello & Steve Tanaka
1 × $6.00 -
×
 Freedom Challenge ( May 2018 – May 2019)
1 × $54.00
Freedom Challenge ( May 2018 – May 2019)
1 × $54.00 -
×
 Building Wealth In Stock Market with David Novac
1 × $6.00
Building Wealth In Stock Market with David Novac
1 × $6.00 -
×
 Low Timeframe Supply & Demand with RROP
1 × $5.00
Low Timeframe Supply & Demand with RROP
1 × $5.00 -
×
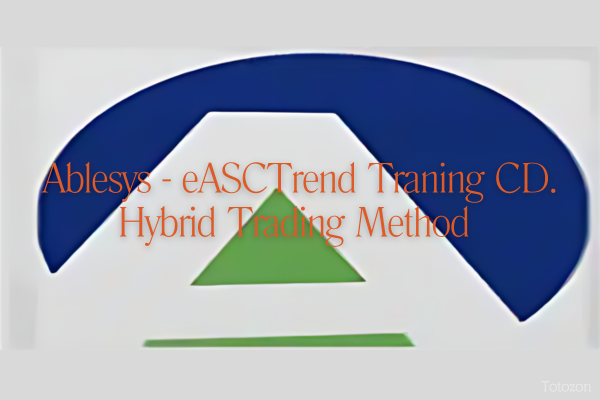 eASCTrend Traning CD. Hybrid Trading Method with Ablesys
1 × $6.00
eASCTrend Traning CD. Hybrid Trading Method with Ablesys
1 × $6.00 -
×
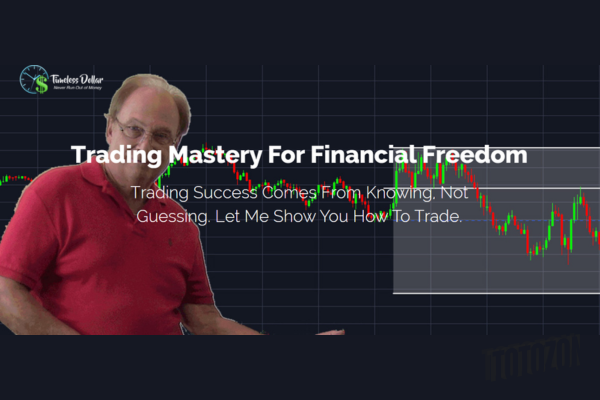 Trading Mastery For Financial Freedom with Marv Eisen
1 × $10.00
Trading Mastery For Financial Freedom with Marv Eisen
1 × $10.00 -
×
 THE NEW SQUEEZE BASIC VERSION: Your Complete System for Timing Explosive Trades with John F. Carter (BASIC VERSION)
1 × $31.00
THE NEW SQUEEZE BASIC VERSION: Your Complete System for Timing Explosive Trades with John F. Carter (BASIC VERSION)
1 × $31.00 -
×
 Classic Indicators Back to the Future with Linda Raschke
1 × $4.00
Classic Indicators Back to the Future with Linda Raschke
1 × $4.00 -
×
 Andy’s EMini Bar – 40 Min System with Joe Ross
1 × $6.00
Andy’s EMini Bar – 40 Min System with Joe Ross
1 × $6.00 -
×
 MMfx Course August 2011 + MT4 Ind. Jan 2012
1 × $15.00
MMfx Course August 2011 + MT4 Ind. Jan 2012
1 × $15.00 -
×
 Building Winning Trading Systems with Tradestation (with CD) - George Pruitt
1 × $6.00
Building Winning Trading Systems with Tradestation (with CD) - George Pruitt
1 × $6.00 -
×
 Supply and Demand 2023 with Willy Jay
1 × $5.00
Supply and Demand 2023 with Willy Jay
1 × $5.00 -
×
 Momentum Explained
1 × $6.00
Momentum Explained
1 × $6.00 -
×
 You AreThe Indicator Online Course
1 × $31.00
You AreThe Indicator Online Course
1 × $31.00 -
×
 Trading Short TermSame Day Trades Sep 2023 with Dan Sheridan & Mark Fenton - Sheridan Options Mentoring
1 × $31.00
Trading Short TermSame Day Trades Sep 2023 with Dan Sheridan & Mark Fenton - Sheridan Options Mentoring
1 × $31.00 -
×
 Marber on Markets – How to Make Money from Charts with Brian Marber
1 × $6.00
Marber on Markets – How to Make Money from Charts with Brian Marber
1 × $6.00 -
×
 Markets 101 Complete Course with Joseph Wang - Central Banking 101
1 × $13.00
Markets 101 Complete Course with Joseph Wang - Central Banking 101
1 × $13.00 -
×
 Best of the Best: Collars with Amy Meissner & Scott Ruble
1 × $15.00
Best of the Best: Collars with Amy Meissner & Scott Ruble
1 × $15.00

Reading & Understanding Charts with Andrew Baxter
$6.00
File Size: 311MB
Delivery Time: 1–12 hours
Media Type: Online Course
Content Proof: Watch Here!
You may check content proof of “Reading & Understanding Chartsb with Andrew Baxter” below:

Reading & Understanding Charts with Andrew Baxter
Introduction to Chart Reading
Charts are essential tools for traders, providing visual representations of market data. Andrew Baxter, a renowned trader and educator, shares his expertise on how to read and understand charts effectively. This article will guide you through the basics and advanced techniques of chart reading, helping you make informed trading decisions.
What are Trading Charts?
Definition and Purpose
Trading charts are graphical representations of price movements over time. They help traders analyze trends, identify patterns, and make predictions about future price movements.
Importance of Chart Reading
Understanding charts is crucial for making data-driven decisions in trading. It reduces emotional trading and enhances your ability to spot opportunities and risks.
Types of Trading Charts
1. Line Charts
Line charts are the simplest form of trading charts, showing the closing prices over a period. They provide a clear view of the overall trend but lack detailed information.
2. Bar Charts
Bar charts display the opening, closing, high, and low prices for each period. They offer more information than line charts and help in understanding price volatility.
3. Candlestick Charts
Candlestick charts are popular due to their detailed and visually appealing format. Each candlestick shows the opening, closing, high, and low prices, making it easier to identify market sentiment.
Understanding Candlestick Charts
Components of a Candlestick
- Body: The filled part showing the opening and closing prices.
- Wicks/Shadows: The thin lines representing the high and low prices.
- Color: Indicates whether the closing price was higher (typically green) or lower (typically red) than the opening price.
Common Candlestick Patterns
1. Doji
A Doji occurs when the opening and closing prices are nearly the same, indicating indecision in the market.
2. Hammer
A Hammer has a small body with a long lower wick, suggesting a potential reversal from a downtrend.
3. Engulfing Pattern
An Engulfing pattern occurs when a larger candlestick completely engulfs the previous smaller candlestick, signaling a potential reversal.
Key Chart Patterns
1. Head and Shoulders
This pattern indicates a reversal and is formed by a peak (head) flanked by two smaller peaks (shoulders).
2. Double Top and Double Bottom
These patterns signal a potential reversal. A double top indicates a bearish reversal, while a double bottom suggests a bullish reversal.
3. Triangles
Triangles are continuation patterns that show a period of consolidation before the price continues in the direction of the previous trend.
Using Technical Indicators
1. Moving Averages
Moving averages smooth out price data to identify trends. Common types include Simple Moving Average (SMA) and Exponential Moving Average (EMA).
2. Relative Strength Index (RSI)
RSI measures the speed and change of price movements, indicating overbought or oversold conditions.
3. Moving Average Convergence Divergence (MACD)
MACD shows the relationship between two moving averages, helping to identify potential buy and sell signals.
Combining Chart Patterns and Indicators
Integrated Analysis
Combining chart patterns with technical indicators enhances the reliability of trading signals. For example, confirming a head and shoulders pattern with RSI divergence can provide a stronger signal.
Practical Application
Use a combination of patterns and indicators to develop a comprehensive trading strategy. This approach helps in making more informed and confident trading decisions.
Advanced Chart Reading Techniques
1. Fibonacci Retracement
Fibonacci retracement levels indicate potential support and resistance levels based on the Fibonacci sequence.
2. Volume Analysis
Volume analysis involves examining the number of shares traded to confirm the strength of a price movement or trend.
3. Divergence
Divergence occurs when the price moves in the opposite direction of an indicator, signaling a potential reversal.
Common Mistakes in Chart Reading
1. Overcomplicating Analysis
Avoid using too many indicators and patterns at once. Focus on a few reliable tools to keep your analysis clear and effective.
2. Ignoring Context
Always consider the broader market context and economic factors. Relying solely on charts without context can lead to misleading conclusions.
3. Emotional Trading
Stick to your analysis and avoid making decisions based on emotions. Emotional trading can undermine even the best chart reading skills.
Benefits of Mastering Chart Reading
1. Improved Decision Making
Accurate chart reading helps you make informed decisions, reducing the risk of losses and increasing the potential for gains.
2. Enhanced Trading Strategy
Understanding charts allows you to develop and refine your trading strategies, making them more effective and adaptable.
3. Increased Confidence
With better chart reading skills, you gain confidence in your trading decisions, leading to more consistent performance.
Conclusion
Reading and understanding charts with insights from Andrew Baxter can significantly improve your trading performance. By mastering various chart types, patterns, and technical indicators, you can make more informed decisions and develop robust trading strategies. Embrace these principles, continuously practice, and refine your skills to become a proficient trader.
Frequently Asked Questions:
What are the main types of trading charts?
The main types are line charts, bar charts, and candlestick charts.
Why are candlestick charts popular?
Candlestick charts are popular due to their detailed and visually appealing format, making it easier to identify market sentiment.
What are some common candlestick patterns?
Common patterns include Doji, Hammer, and Engulfing patterns.
How can technical indicators enhance chart reading?
Technical indicators like moving averages, RSI, and MACD help identify trends, momentum, and potential buy/sell signals.
What are some advanced chart reading techniques?
Advanced techniques include Fibonacci retracement, volume analysis, and divergence.
Be the first to review “Reading & Understanding Charts with Andrew Baxter”
You must be logged in to post a review.
Related products

Forex Trading
Original price was: $2,000.00.$23.00Current price is: $23.00.
Forex Trading
Original price was: $1,898.00.$10.00Current price is: $10.00.

Forex Trading
Original price was: $249.00.$15.00Current price is: $15.00.

Forex Trading
Original price was: $239.00.$8.00Current price is: $8.00.

Forex Trading
Original price was: $2,995.00.$31.00Current price is: $31.00.

Forex Trading
Original price was: $125.00.$17.00Current price is: $17.00.

Original price was: $1,200.00.$23.00Current price is: $23.00.
Original price was: $139.00.$23.00Current price is: $23.00.

Forex Trading
Original price was: $550.00.$5.00Current price is: $5.00.

Original price was: $299.00.$8.00Current price is: $8.00.

Original price was: $1,849.00.$15.00Current price is: $15.00.

Forex Trading
Original price was: $2,997.00.$23.00Current price is: $23.00.

Original price was: $999.00.$5.00Current price is: $5.00.
Original price was: $799.00.$15.00Current price is: $15.00.

Original price was: $497.00.$31.00Current price is: $31.00.

Forex Trading
Original price was: $500.00.$5.00Current price is: $5.00.

Forex Trading
Original price was: $697.00.$5.00Current price is: $5.00.

Forex Trading
Original price was: $4,997.00.$27.00Current price is: $27.00.

Forex Trading
Original price was: $799.00.$15.00Current price is: $15.00.

Original price was: $2,120.00.$15.00Current price is: $15.00.

Reviews
There are no reviews yet.