-
×
 W.O.W. Guaranteed Income with Chuck Hughes
1 × $31.00
W.O.W. Guaranteed Income with Chuck Hughes
1 × $31.00 -
×
 Generate Weekly Income by Trend-Trading Stocks Intraday Class with Corey Rosenbloom
1 × $6.00
Generate Weekly Income by Trend-Trading Stocks Intraday Class with Corey Rosenbloom
1 × $6.00 -
×
 Lazy Gap Trader Course with David Frost
1 × $6.00
Lazy Gap Trader Course with David Frost
1 × $6.00 -
×
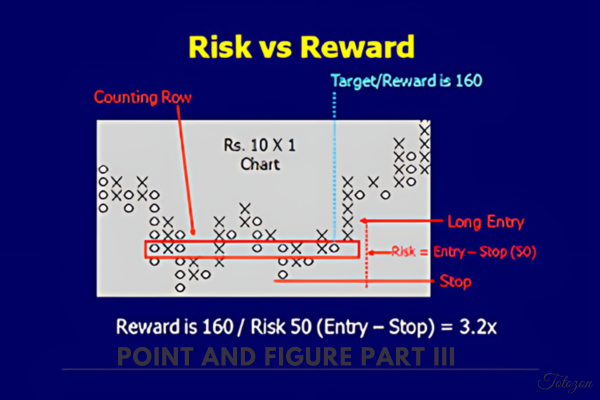 Point And Figure Part III By Bruce Fraser & Roman Bogomazov - Wyckoff Analytics
1 × $23.00
Point And Figure Part III By Bruce Fraser & Roman Bogomazov - Wyckoff Analytics
1 × $23.00 -
×
 Weekly Diagonal Spreads for Consistent Income By Doc Severson
1 × $6.00
Weekly Diagonal Spreads for Consistent Income By Doc Severson
1 × $6.00 -
×
 Road Congestion Pricing in Europe: Implications for the United States with Harry Richardson & Chang-Hee Christine Bae
1 × $6.00
Road Congestion Pricing in Europe: Implications for the United States with Harry Richardson & Chang-Hee Christine Bae
1 × $6.00 -
×
 Aeron V5 Scalper+Grid
1 × $23.00
Aeron V5 Scalper+Grid
1 × $23.00 -
×
 The New Electronic Traders with Jonathan R.Aspartore
1 × $6.00
The New Electronic Traders with Jonathan R.Aspartore
1 × $6.00 -
×
 Long/Short Market Dynamics: Trading Strategies for Today's Markets with Clive Corcoran
1 × $6.00
Long/Short Market Dynamics: Trading Strategies for Today's Markets with Clive Corcoran
1 × $6.00 -
×
 Bing CPA Bootcamp
1 × $15.00
Bing CPA Bootcamp
1 × $15.00 -
×
 I Segreti Del Trading Di Breve Termine (Italian) with Larry Williams
1 × $6.00
I Segreti Del Trading Di Breve Termine (Italian) with Larry Williams
1 × $6.00 -
×
 Momentum Explained. Vol.2 with Martin Pring
1 × $4.00
Momentum Explained. Vol.2 with Martin Pring
1 × $4.00 -
×
 Trading Psychology - How to Think Like a Professional Trader - 4 DVD
1 × $6.00
Trading Psychology - How to Think Like a Professional Trader - 4 DVD
1 × $6.00 -
×
 Real Options in Practice with Marion A.Brach
1 × $6.00
Real Options in Practice with Marion A.Brach
1 × $6.00 -
×
 Basic Astrotech
1 × $6.00
Basic Astrotech
1 × $6.00 -
×
 Field of Vision Program – Digital Download
1 × $31.00
Field of Vision Program – Digital Download
1 × $31.00 -
×
 Offshore Keys (2023)
1 × $5.00
Offshore Keys (2023)
1 × $5.00 -
×
 Dynamic Trader 6 Dynamic Trader Real Time and End Of Day
1 × $6.00
Dynamic Trader 6 Dynamic Trader Real Time and End Of Day
1 × $6.00 -
×
 Forex Robotron (Unlocked)
1 × $6.00
Forex Robotron (Unlocked)
1 × $6.00 -
×
 Trading The Hobbs Triple Crown Strategy with Derrik Hobbs
1 × $6.00
Trading The Hobbs Triple Crown Strategy with Derrik Hobbs
1 × $6.00 -
×
 Weekly Playbook Workshop #1
1 × $31.00
Weekly Playbook Workshop #1
1 × $31.00 -
×
 All About Mutual Funds with Bruce Jacobs
1 × $6.00
All About Mutual Funds with Bruce Jacobs
1 × $6.00 -
×
 MATS Market Auction Trading System with Ryan Watts
1 × $6.00
MATS Market Auction Trading System with Ryan Watts
1 × $6.00 -
×
 The Thirty-Second Jewel in PDF with Constance Brown
1 × $8.00
The Thirty-Second Jewel in PDF with Constance Brown
1 × $8.00 -
×
 Trading Systems Explained with Martin Pring
1 × $6.00
Trading Systems Explained with Martin Pring
1 × $6.00 -
×
 Managing Debt for Dummies with John Ventura
1 × $6.00
Managing Debt for Dummies with John Ventura
1 × $6.00 -
×
 The Wizard Training Course with Mitch King
1 × $6.00
The Wizard Training Course with Mitch King
1 × $6.00 -
×
 Sharp Edge Institutional Ultimate Trade Program – CompassFX
1 × $101.00
Sharp Edge Institutional Ultimate Trade Program – CompassFX
1 × $101.00 -
×
 Stable Adaptive Control for Nonlinear Systems with Jeffrey Spooner
1 × $6.00
Stable Adaptive Control for Nonlinear Systems with Jeffrey Spooner
1 × $6.00 -
×
 Secrets of Trading GBP, JPY, and CHF By Boris Schlossberg and Kathy Lien - Bkforex
1 × $6.00
Secrets of Trading GBP, JPY, and CHF By Boris Schlossberg and Kathy Lien - Bkforex
1 × $6.00 -
×
 Electronic Trading "TNT" IV Tips Tricks and Other Trading Stuff with Joe Ross & Mark Cherlin
1 × $6.00
Electronic Trading "TNT" IV Tips Tricks and Other Trading Stuff with Joe Ross & Mark Cherlin
1 × $6.00 -
×
 Quantamentals - The Next Great Forefront Of Trading and Investing with Trading Markets
1 × $8.00
Quantamentals - The Next Great Forefront Of Trading and Investing with Trading Markets
1 × $8.00 -
×
 Joshua ICT ChartLab 2023
1 × $5.00
Joshua ICT ChartLab 2023
1 × $5.00 -
×
 The Orderflow Masterclass with PrimeTrading
1 × $17.00
The Orderflow Masterclass with PrimeTrading
1 × $17.00 -
×
 Introduction to Fibonacci Time Analysis with Carolyn Boroden
1 × $6.00
Introduction to Fibonacci Time Analysis with Carolyn Boroden
1 × $6.00 -
×
 Scalp Trading Mini Course with Jayson Casper
1 × $23.00
Scalp Trading Mini Course with Jayson Casper
1 × $23.00 -
×
 CFA Pro Qbank 2007 & 2008 with Schweser
1 × $6.00
CFA Pro Qbank 2007 & 2008 with Schweser
1 × $6.00 -
×
 Linear Regression 3030 with David Elliott
1 × $6.00
Linear Regression 3030 with David Elliott
1 × $6.00 -
×
 Professional Trading Strategies 2023 with Jared Wesley - Live Traders
1 × $5.00
Professional Trading Strategies 2023 with Jared Wesley - Live Traders
1 × $5.00 -
×
 Ultimate Trading Course with Dodgy's Dungeon
1 × $8.00
Ultimate Trading Course with Dodgy's Dungeon
1 × $8.00 -
×
 Forex Powerband Dominator
1 × $6.00
Forex Powerband Dominator
1 × $6.00 -
×
 Sector Trading Strategies: Turning Steady Profits Even in Stubborn Markets By Deron Wagner & John Boyer
1 × $6.00
Sector Trading Strategies: Turning Steady Profits Even in Stubborn Markets By Deron Wagner & John Boyer
1 × $6.00 -
×
 Launchpad Trading
1 × $23.00
Launchpad Trading
1 × $23.00 -
×
 Bradley F.Cowan (Cycle-Trader.com)
1 × $23.00
Bradley F.Cowan (Cycle-Trader.com)
1 × $23.00 -
×
 Freak Forex Fundamentals with Ken FX Freak
1 × $6.00
Freak Forex Fundamentals with Ken FX Freak
1 × $6.00 -
×
 Trading System Mastery with Brian McAboy
1 × $6.00
Trading System Mastery with Brian McAboy
1 × $6.00 -
×
 Security Analysis (The Classic 1934 Ed.) with Benjamin Graham
1 × $6.00
Security Analysis (The Classic 1934 Ed.) with Benjamin Graham
1 × $6.00 -
×
 Technical Analysis & The Nasdaq with Alan Rich
1 × $6.00
Technical Analysis & The Nasdaq with Alan Rich
1 × $6.00 -
×
 Winning with Options with Michael Thomsett
1 × $6.00
Winning with Options with Michael Thomsett
1 × $6.00 -
×
 Crystal Ball Pack PLUS bonus Live Trade By Pat Mitchell - Trick Trades
1 × $20.00
Crystal Ball Pack PLUS bonus Live Trade By Pat Mitchell - Trick Trades
1 × $20.00 -
×
 FOREX STRATEGY #1 with Steven Primo
1 × $39.00
FOREX STRATEGY #1 with Steven Primo
1 × $39.00 -
×
 Binance Trading Bots Passive Income with Rhodnnie Jessnor Austria
1 × $5.00
Binance Trading Bots Passive Income with Rhodnnie Jessnor Austria
1 × $5.00 -
×
 8 Successful Iron Condor Methodologies with Dan Sheridan
1 × $23.00
8 Successful Iron Condor Methodologies with Dan Sheridan
1 × $23.00 -
×
 Options Plain & Simple with Lenni Jordan
1 × $6.00
Options Plain & Simple with Lenni Jordan
1 × $6.00 -
×
 Catching the Bounce
1 × $6.00
Catching the Bounce
1 × $6.00 -
×
 Dan Sheridan Volatility Class
1 × $6.00
Dan Sheridan Volatility Class
1 × $6.00 -
×
 Momentum Mastery with Traderlion Richard Moglen & Ben Bennett
1 × $15.00
Momentum Mastery with Traderlion Richard Moglen & Ben Bennett
1 × $15.00 -
×
 Essentials in Quantitative Trading QT01 By HangukQuant's
1 × $23.00
Essentials in Quantitative Trading QT01 By HangukQuant's
1 × $23.00 -
×
 Using Long, Medium and Short Term Trends to Forecast Turning Points (Article)
1 × $6.00
Using Long, Medium and Short Term Trends to Forecast Turning Points (Article)
1 × $6.00 -
×
 Long-Term Secrets to Short-Term Trading (Ebook) with Larry Williams
1 × $6.00
Long-Term Secrets to Short-Term Trading (Ebook) with Larry Williams
1 × $6.00 -
×
 The Guerrilla Online Video Course with Guerrilla Trading
1 × $5.00
The Guerrilla Online Video Course with Guerrilla Trading
1 × $5.00 -
×
 Intermarket Technical Analysis with John J.Murphy
1 × $6.00
Intermarket Technical Analysis with John J.Murphy
1 × $6.00 -
×
 Big Fish: Mako Momentum Strategy
1 × $23.00
Big Fish: Mako Momentum Strategy
1 × $23.00 -
×
 Crypto Momentum Trading System with Pollinate Trading
1 × $34.00
Crypto Momentum Trading System with Pollinate Trading
1 × $34.00 -
×
 Gold Nuggets for Stock and Commodity Traders with George Bayer
1 × $6.00
Gold Nuggets for Stock and Commodity Traders with George Bayer
1 × $6.00 -
×
 White Phoenix’s The Smart (Money) Approach to Trading with Jayson Casper
1 × $39.00
White Phoenix’s The Smart (Money) Approach to Trading with Jayson Casper
1 × $39.00 -
×
 Options Trading & Ultimate MasterClass With Tyrone Abela - FX Evolution
1 × $54.00
Options Trading & Ultimate MasterClass With Tyrone Abela - FX Evolution
1 × $54.00 -
×
 Pairs Trading: Quantitative Methods and Analysis with Ganapathy Vidyamurthy
1 × $6.00
Pairs Trading: Quantitative Methods and Analysis with Ganapathy Vidyamurthy
1 × $6.00 -
×
 Options University - FX Technical Analysis
1 × $6.00
Options University - FX Technical Analysis
1 × $6.00 -
×
 The A14 Weekly Option Strategy Workshop with Amy Meissner
1 × $23.00
The A14 Weekly Option Strategy Workshop with Amy Meissner
1 × $23.00 -
×
 The Newsbeat Bandit Program with Mark Melnick - T3 Live
1 × $6.00
The Newsbeat Bandit Program with Mark Melnick - T3 Live
1 × $6.00 -
×
 Chart Your Way to Profits (2nd Ed.) with Tim Knight
1 × $6.00
Chart Your Way to Profits (2nd Ed.) with Tim Knight
1 × $6.00 -
×
 Pristine - Tom Willard – Creating The Ultimate Trading Psychology Using 3 Key Concepts
1 × $6.00
Pristine - Tom Willard – Creating The Ultimate Trading Psychology Using 3 Key Concepts
1 × $6.00 -
×
 B.O.S.S. Swing with Pat Mitchell – Trick Trades
1 × $39.00
B.O.S.S. Swing with Pat Mitchell – Trick Trades
1 × $39.00 -
×
 Building Winning Trading Systems
1 × $6.00
Building Winning Trading Systems
1 × $6.00 -
×
 Krautgap By John Piper
1 × $6.00
Krautgap By John Piper
1 × $6.00 -
×
 Divorcing the Dow: Using Revolutionary Market Indicators to Profit from the Stealth Boom Ahead - Jim Troup & Sharon Michalsky
1 × $6.00
Divorcing the Dow: Using Revolutionary Market Indicators to Profit from the Stealth Boom Ahead - Jim Troup & Sharon Michalsky
1 × $6.00 -
×
 ICT Mastery with Casper SMC
1 × $14.00
ICT Mastery with Casper SMC
1 × $14.00 -
×
 Pro9Trader 2016 Ultimate Suite v3.7
1 × $62.00
Pro9Trader 2016 Ultimate Suite v3.7
1 × $62.00 -
×
 May Madness with LIT Trading
1 × $5.00
May Madness with LIT Trading
1 × $5.00 -
×
 Brian James Sklenka Package
1 × $31.00
Brian James Sklenka Package
1 × $31.00 -
×
 Stock Market–Swing Trading Strategies for Wall Street with Bill Wermin
1 × $6.00
Stock Market–Swing Trading Strategies for Wall Street with Bill Wermin
1 × $6.00 -
×
 Advanced Technical Analysis PART2 with Corey Halliday
1 × $6.00
Advanced Technical Analysis PART2 with Corey Halliday
1 × $6.00 -
×
 Code 6 + 7 Course with Oil Trading Academy
1 × $41.00
Code 6 + 7 Course with Oil Trading Academy
1 × $41.00 -
×
 Best of the Best: Collars with Amy Meissner & Scott Ruble
1 × $15.00
Best of the Best: Collars with Amy Meissner & Scott Ruble
1 × $15.00 -
×
 The Market Geometry Basic Seminar DVD with Market Geometry
1 × $31.00
The Market Geometry Basic Seminar DVD with Market Geometry
1 × $31.00 -
×
 A Plan to make $3k Monthly on $25k with Short Term Trades with Dan Sheridan
1 × $23.00
A Plan to make $3k Monthly on $25k with Short Term Trades with Dan Sheridan
1 × $23.00 -
×
 The TradingKey - Mastering Elliott Wave by Rob Roy 2010 + Complete Workbooks with HUBB Financial
1 × $6.00
The TradingKey - Mastering Elliott Wave by Rob Roy 2010 + Complete Workbooks with HUBB Financial
1 × $6.00 -
×
 Correct Stage for Average with Stan Weinstein
1 × $6.00
Correct Stage for Average with Stan Weinstein
1 × $6.00 -
×
 Inner Cicle Trader - ICT Methods with Michael Huddleston
1 × $5.00
Inner Cicle Trader - ICT Methods with Michael Huddleston
1 × $5.00 -
×
 AI For Traders with Trading Markets
1 × $31.00
AI For Traders with Trading Markets
1 × $31.00 -
×
 Ultra Blue Forex 2024 with Russ Horn
1 × $17.00
Ultra Blue Forex 2024 with Russ Horn
1 × $17.00 -
×
 How To Read The Market Professionally with TradeSmart
1 × $27.00
How To Read The Market Professionally with TradeSmart
1 × $27.00

Reading & Understanding Charts with Andrew Baxter
$6.00
File Size: 311MB
Delivery Time: 1–12 hours
Media Type: Online Course
Content Proof: Watch Here!
You may check content proof of “Reading & Understanding Chartsb with Andrew Baxter” below:

Reading & Understanding Charts with Andrew Baxter
Introduction to Chart Reading
Charts are essential tools for traders, providing visual representations of market data. Andrew Baxter, a renowned trader and educator, shares his expertise on how to read and understand charts effectively. This article will guide you through the basics and advanced techniques of chart reading, helping you make informed trading decisions.
What are Trading Charts?
Definition and Purpose
Trading charts are graphical representations of price movements over time. They help traders analyze trends, identify patterns, and make predictions about future price movements.
Importance of Chart Reading
Understanding charts is crucial for making data-driven decisions in trading. It reduces emotional trading and enhances your ability to spot opportunities and risks.
Types of Trading Charts
1. Line Charts
Line charts are the simplest form of trading charts, showing the closing prices over a period. They provide a clear view of the overall trend but lack detailed information.
2. Bar Charts
Bar charts display the opening, closing, high, and low prices for each period. They offer more information than line charts and help in understanding price volatility.
3. Candlestick Charts
Candlestick charts are popular due to their detailed and visually appealing format. Each candlestick shows the opening, closing, high, and low prices, making it easier to identify market sentiment.
Understanding Candlestick Charts
Components of a Candlestick
- Body: The filled part showing the opening and closing prices.
- Wicks/Shadows: The thin lines representing the high and low prices.
- Color: Indicates whether the closing price was higher (typically green) or lower (typically red) than the opening price.
Common Candlestick Patterns
1. Doji
A Doji occurs when the opening and closing prices are nearly the same, indicating indecision in the market.
2. Hammer
A Hammer has a small body with a long lower wick, suggesting a potential reversal from a downtrend.
3. Engulfing Pattern
An Engulfing pattern occurs when a larger candlestick completely engulfs the previous smaller candlestick, signaling a potential reversal.
Key Chart Patterns
1. Head and Shoulders
This pattern indicates a reversal and is formed by a peak (head) flanked by two smaller peaks (shoulders).
2. Double Top and Double Bottom
These patterns signal a potential reversal. A double top indicates a bearish reversal, while a double bottom suggests a bullish reversal.
3. Triangles
Triangles are continuation patterns that show a period of consolidation before the price continues in the direction of the previous trend.
Using Technical Indicators
1. Moving Averages
Moving averages smooth out price data to identify trends. Common types include Simple Moving Average (SMA) and Exponential Moving Average (EMA).
2. Relative Strength Index (RSI)
RSI measures the speed and change of price movements, indicating overbought or oversold conditions.
3. Moving Average Convergence Divergence (MACD)
MACD shows the relationship between two moving averages, helping to identify potential buy and sell signals.
Combining Chart Patterns and Indicators
Integrated Analysis
Combining chart patterns with technical indicators enhances the reliability of trading signals. For example, confirming a head and shoulders pattern with RSI divergence can provide a stronger signal.
Practical Application
Use a combination of patterns and indicators to develop a comprehensive trading strategy. This approach helps in making more informed and confident trading decisions.
Advanced Chart Reading Techniques
1. Fibonacci Retracement
Fibonacci retracement levels indicate potential support and resistance levels based on the Fibonacci sequence.
2. Volume Analysis
Volume analysis involves examining the number of shares traded to confirm the strength of a price movement or trend.
3. Divergence
Divergence occurs when the price moves in the opposite direction of an indicator, signaling a potential reversal.
Common Mistakes in Chart Reading
1. Overcomplicating Analysis
Avoid using too many indicators and patterns at once. Focus on a few reliable tools to keep your analysis clear and effective.
2. Ignoring Context
Always consider the broader market context and economic factors. Relying solely on charts without context can lead to misleading conclusions.
3. Emotional Trading
Stick to your analysis and avoid making decisions based on emotions. Emotional trading can undermine even the best chart reading skills.
Benefits of Mastering Chart Reading
1. Improved Decision Making
Accurate chart reading helps you make informed decisions, reducing the risk of losses and increasing the potential for gains.
2. Enhanced Trading Strategy
Understanding charts allows you to develop and refine your trading strategies, making them more effective and adaptable.
3. Increased Confidence
With better chart reading skills, you gain confidence in your trading decisions, leading to more consistent performance.
Conclusion
Reading and understanding charts with insights from Andrew Baxter can significantly improve your trading performance. By mastering various chart types, patterns, and technical indicators, you can make more informed decisions and develop robust trading strategies. Embrace these principles, continuously practice, and refine your skills to become a proficient trader.
Frequently Asked Questions:
What are the main types of trading charts?
The main types are line charts, bar charts, and candlestick charts.
Why are candlestick charts popular?
Candlestick charts are popular due to their detailed and visually appealing format, making it easier to identify market sentiment.
What are some common candlestick patterns?
Common patterns include Doji, Hammer, and Engulfing patterns.
How can technical indicators enhance chart reading?
Technical indicators like moving averages, RSI, and MACD help identify trends, momentum, and potential buy/sell signals.
What are some advanced chart reading techniques?
Advanced techniques include Fibonacci retracement, volume analysis, and divergence.
Be the first to review “Reading & Understanding Charts with Andrew Baxter”
You must be logged in to post a review.
Related products

Original price was: $895.00.$15.00Current price is: $15.00.

Original price was: $1,200.00.$23.00Current price is: $23.00.

Forex Trading
Original price was: $2,000.00.$23.00Current price is: $23.00.

Original price was: $2,120.00.$15.00Current price is: $15.00.

Original price was: $1,849.00.$15.00Current price is: $15.00.
Original price was: $310.00.$23.00Current price is: $23.00.

Original price was: $497.00.$31.00Current price is: $31.00.
Forex Trading
Original price was: $1,898.00.$10.00Current price is: $10.00.

Original price was: $299.00.$8.00Current price is: $8.00.
Forex Trading
Original price was: $125.00.$17.00Current price is: $17.00.
Forex Trading
Original price was: $2,995.00.$31.00Current price is: $31.00.

Forex Trading
Original price was: $799.00.$15.00Current price is: $15.00.

Original price was: $695.00.$41.00Current price is: $41.00.

Original price was: $497.00.$11.00Current price is: $11.00.
Original price was: $700.00.$39.00Current price is: $39.00.

Original price was: $997.00.$8.00Current price is: $8.00.

Original price was: $4,995.00.$15.00Current price is: $15.00.

Forex Trading
Original price was: $397.00.$31.00Current price is: $31.00.

Forex Trading
Original price was: $999.00.$15.00Current price is: $15.00.
Forex Trading
Original price was: $239.00.$8.00Current price is: $8.00.

Reviews
There are no reviews yet.