-
×
 Profit Power Seminar
1 × $23.00
Profit Power Seminar
1 × $23.00 -
×
 Compound Stock Earnings Master Class 2009 Ft Worth Tx September 12 13 DVD set
1 × $6.00
Compound Stock Earnings Master Class 2009 Ft Worth Tx September 12 13 DVD set
1 × $6.00 -
×
 Market Energy Trader with Top Trade Tools
1 × $5.00
Market Energy Trader with Top Trade Tools
1 × $5.00 -
×
 SQX Mentorship with Tip Toe Hippo
1 × $23.00
SQX Mentorship with Tip Toe Hippo
1 × $23.00 -
×
 Top Ultimate Breakout with Top Trade Tools
1 × $6.00
Top Ultimate Breakout with Top Trade Tools
1 × $6.00 -
×
 My Trading Strategy with Evolved Traders
1 × $5.00
My Trading Strategy with Evolved Traders
1 × $5.00 -
×
 Pattern, Price & Time: Using Gann Theory in Trading Systems (1st Edition) with James Hyerczyk
1 × $6.00
Pattern, Price & Time: Using Gann Theory in Trading Systems (1st Edition) with James Hyerczyk
1 × $6.00 -
×
 Technical Analysis 201: From Chart Setups to Trading Execution Methodology Class with Jeff Bierman
1 × $6.00
Technical Analysis 201: From Chart Setups to Trading Execution Methodology Class with Jeff Bierman
1 × $6.00 -
×
 The 10%ers with Trader Mike
1 × $5.00
The 10%ers with Trader Mike
1 × $5.00 -
×
 The Crypto Code with Joel Peterson - Adam Short
1 × $15.00
The Crypto Code with Joel Peterson - Adam Short
1 × $15.00 -
×
 Modern Darvas Trading
1 × $6.00
Modern Darvas Trading
1 × $6.00 -
×
 Selected Articles by the Late by George Lindsay
1 × $6.00
Selected Articles by the Late by George Lindsay
1 × $6.00 -
×
 Mastering Collar Trades Pro with Vince Vora - TradingWins
1 × $6.00
Mastering Collar Trades Pro with Vince Vora - TradingWins
1 × $6.00 -
×
 Day & Position Trading Using DiNapoli Levels with Joe Dinapoli & Merrick Okamoto
1 × $6.00
Day & Position Trading Using DiNapoli Levels with Joe Dinapoli & Merrick Okamoto
1 × $6.00 -
×
 Covered Calls Income Generation for Your Stocks With Don Kaufman
1 × $6.00
Covered Calls Income Generation for Your Stocks With Don Kaufman
1 × $6.00 -
×
 Become A Quant Trader Bundle with Lachezar Haralampiev & Radoslav Haralampiev - Quant Factory
1 × $17.00
Become A Quant Trader Bundle with Lachezar Haralampiev & Radoslav Haralampiev - Quant Factory
1 × $17.00 -
×
 Trading Analysis Crash Course
1 × $23.00
Trading Analysis Crash Course
1 × $23.00 -
×
 Finding Alpha: The Search for Alpha When Risk and Return Break Down with Eric Falkenstein
1 × $6.00
Finding Alpha: The Search for Alpha When Risk and Return Break Down with Eric Falkenstein
1 × $6.00 -
×
 The Naked Eye: Raw Data Analytics with Edgar Torres - Raw Data Analytics
1 × $8.00
The Naked Eye: Raw Data Analytics with Edgar Torres - Raw Data Analytics
1 × $8.00 -
×
![Trading The Elliott Wave Indicator (2003) [1 MP4] by Robert Prechter image](https://www.totozon.com/wp-content/uploads/2024/05/Trading-The-Elliott-Wave-Indicator-2003-1-MP4-by-Robert-Prechter-image.png) Trading The Elliott Wave Indicator (2003) [1 MP4] - Robert Prechter
1 × $6.00
Trading The Elliott Wave Indicator (2003) [1 MP4] - Robert Prechter
1 × $6.00 -
×
 Trading Volatility - The Ultimate Course with Master Trader
1 × $69.00
Trading Volatility - The Ultimate Course with Master Trader
1 × $69.00 -
×
 TIMfundamentals with Timothy Sykes
1 × $5.00
TIMfundamentals with Timothy Sykes
1 × $5.00 -
×
 Algorithmic Trading Systems: Advanced Gap Strategies for the Futures Markets with David Bean
1 × $5.00
Algorithmic Trading Systems: Advanced Gap Strategies for the Futures Markets with David Bean
1 × $5.00 -
×
 Momentum Explained
1 × $6.00
Momentum Explained
1 × $6.00 -
×
 Market Risk Analysis, Volume III, Pricing, Hedging and Trading Financial Instruments with Carol Alexander
1 × $6.00
Market Risk Analysis, Volume III, Pricing, Hedging and Trading Financial Instruments with Carol Alexander
1 × $6.00 -
×
 How To Read The Market Professionally with TradeSmart
1 × $27.00
How To Read The Market Professionally with TradeSmart
1 × $27.00 -
×
 Wealth Management with Dimitris Chorafas
1 × $6.00
Wealth Management with Dimitris Chorafas
1 × $6.00 -
×
 KASH-FX JOURNAL
1 × $10.00
KASH-FX JOURNAL
1 × $10.00 -
×
 Stock Market 101 with Sabrina Peterson
1 × $4.00
Stock Market 101 with Sabrina Peterson
1 × $4.00 -
×
 XLT - Futures Trading Course
1 × $54.00
XLT - Futures Trading Course
1 × $54.00 -
×
 Wheels of Gann. Top Secret Forecast Guide with Pat Reda
1 × $6.00
Wheels of Gann. Top Secret Forecast Guide with Pat Reda
1 × $6.00 -
×
 The A14 Weekly Option Strategy Workshop with Amy Meissner
1 × $23.00
The A14 Weekly Option Strategy Workshop with Amy Meissner
1 × $23.00 -
×
 Selling Options for Income, Profits & Opportunistic Hedge Trading Management with Powercycletrading
1 × $69.00
Selling Options for Income, Profits & Opportunistic Hedge Trading Management with Powercycletrading
1 × $69.00 -
×
 Right Line Trading IndicatorSuite (May 2015)
1 × $31.00
Right Line Trading IndicatorSuite (May 2015)
1 × $31.00 -
×
 Latent Curve Models with Kenneth Bollen
1 × $6.00
Latent Curve Models with Kenneth Bollen
1 × $6.00 -
×
 Online Course: Forex Trading By Fxtc.co
1 × $5.00
Online Course: Forex Trading By Fxtc.co
1 × $5.00 -
×
 Profit in the Futures Markets! with Jack Bernstein
1 × $6.00
Profit in the Futures Markets! with Jack Bernstein
1 × $6.00 -
×
 Day Trading 101 How To Day Trade Stocks for Passive Income
1 × $6.00
Day Trading 101 How To Day Trade Stocks for Passive Income
1 × $6.00 -
×
 Dynamic Trading Indicators with Mark W.Helweg, David C.Stendahl
1 × $6.00
Dynamic Trading Indicators with Mark W.Helweg, David C.Stendahl
1 × $6.00 -
×
 B.O.S.S. Swing with Pat Mitchell – Trick Trades
1 × $39.00
B.O.S.S. Swing with Pat Mitchell – Trick Trades
1 × $39.00 -
×
 Manage By The Greeks 2016 with Sheridan
1 × $6.00
Manage By The Greeks 2016 with Sheridan
1 × $6.00 -
×
 How to Use Gann Techniques to Implement a Trading System
1 × $6.00
How to Use Gann Techniques to Implement a Trading System
1 × $6.00 -
×
 Traders Forge with Ryan Litchfield
1 × $6.00
Traders Forge with Ryan Litchfield
1 × $6.00 -
×
 Matrix Spread Options Trading Course with Base Camp Trading
1 × $31.00
Matrix Spread Options Trading Course with Base Camp Trading
1 × $31.00 -
×
 PowerWave Trading with Dar Wong
1 × $4.00
PowerWave Trading with Dar Wong
1 × $4.00 -
×
 Foundations of Technical Analysis (Article) with Andrew W.Lo
1 × $6.00
Foundations of Technical Analysis (Article) with Andrew W.Lo
1 × $6.00 -
×
 AM Trader - Strategy Training Course
1 × $23.00
AM Trader - Strategy Training Course
1 × $23.00 -
×
 The Sweep Show with Scott Pulcini Trader
1 × $23.00
The Sweep Show with Scott Pulcini Trader
1 × $23.00 -
×
 Developing Mindfulness: The Observer of Thought with Traders State Of Mind
1 × $6.00
Developing Mindfulness: The Observer of Thought with Traders State Of Mind
1 × $6.00 -
×
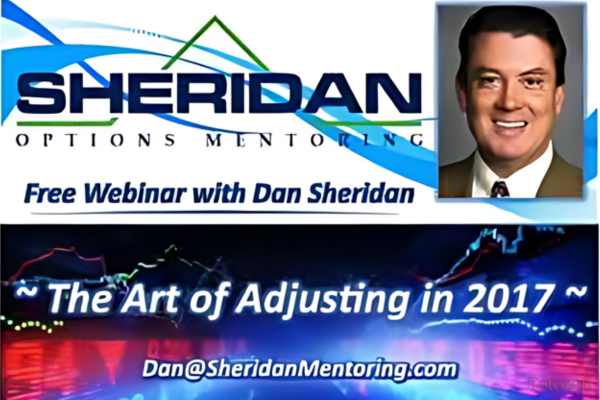 THE ART OF ADJUSTING IN 2017
1 × $6.00
THE ART OF ADJUSTING IN 2017
1 × $6.00 -
×
 Advanced Trading Strategies with Larry Connors
1 × $6.00
Advanced Trading Strategies with Larry Connors
1 × $6.00 -
×
 Profit Trading VIX Options Course with Don Kaufman
1 × $6.00
Profit Trading VIX Options Course with Don Kaufman
1 × $6.00 -
×
 Trading Systems Explained with Martin Pring
1 × $6.00
Trading Systems Explained with Martin Pring
1 × $6.00 -
×
 Options, Futures & Other Derivatives (6th Ed.)
1 × $6.00
Options, Futures & Other Derivatives (6th Ed.)
1 × $6.00 -
×
 Home Run Options Trading Course with Dave Aquino - Base Camp Trading
1 × $11.00
Home Run Options Trading Course with Dave Aquino - Base Camp Trading
1 × $11.00 -
×
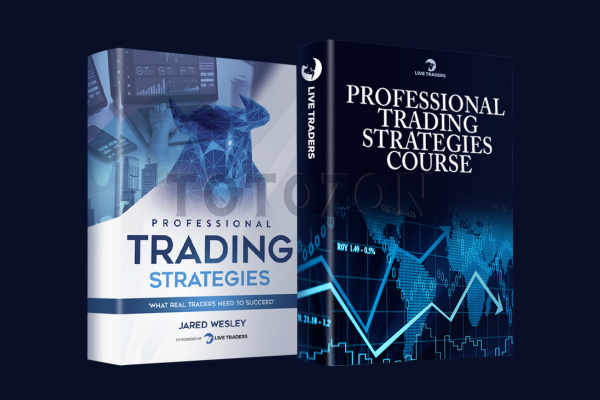 Professional Trading Strategies 2023 with Jared Wesley - Live Traders
1 × $5.00
Professional Trading Strategies 2023 with Jared Wesley - Live Traders
1 × $5.00 -
×
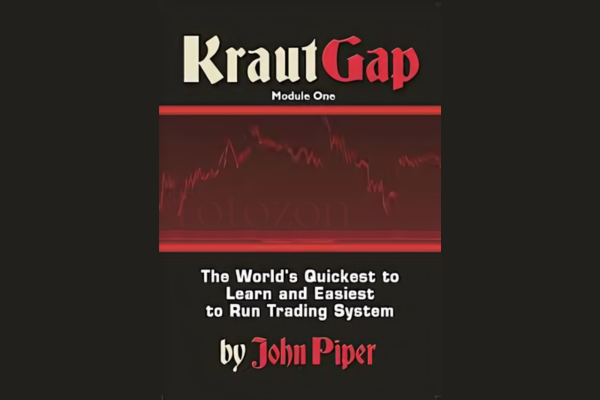 Krautgap By John Piper
1 × $6.00
Krautgap By John Piper
1 × $6.00 -
×
 The Ticker Investment Digest Articles
1 × $6.00
The Ticker Investment Digest Articles
1 × $6.00 -
×
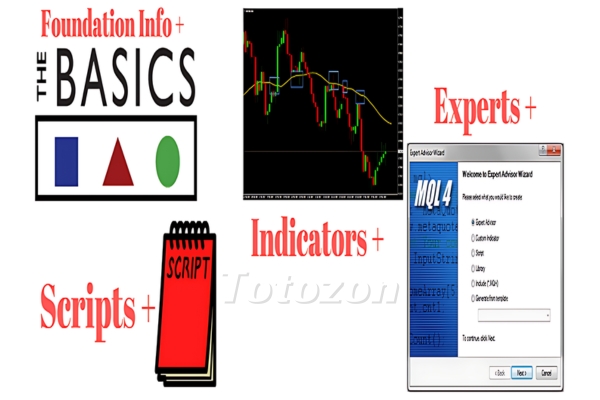 Mql4 Bundle: Basics, Scripts, Indicators, Experts with Jim Hodges
1 × $15.00
Mql4 Bundle: Basics, Scripts, Indicators, Experts with Jim Hodges
1 × $15.00 -
×
 The Complete Guide to Technical Indicators with Mark Larson
1 × $6.00
The Complete Guide to Technical Indicators with Mark Larson
1 × $6.00 -
×
 Stock Market Rules (2nd Ed.) with Michael Sheimo
1 × $6.00
Stock Market Rules (2nd Ed.) with Michael Sheimo
1 × $6.00 -
×
 Profitable Strategies with Gemify Academy
1 × $10.00
Profitable Strategies with Gemify Academy
1 × $10.00 -
×
 Opening Bell Income Strategy with Todd Mitchell
1 × $54.00
Opening Bell Income Strategy with Todd Mitchell
1 × $54.00 -
×
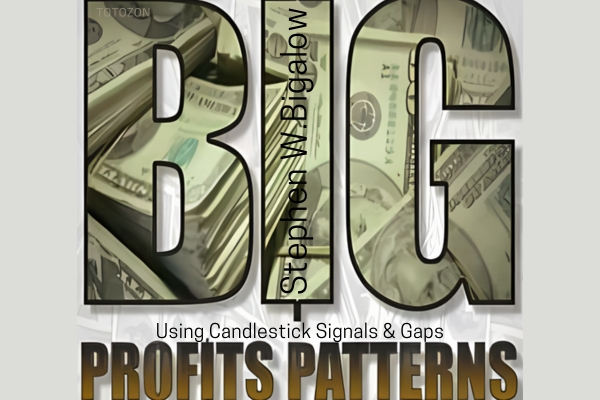 Big Profit Patterns Using Candlestick Signals & Gaps with Stephen W.Bigalow
1 × $6.00
Big Profit Patterns Using Candlestick Signals & Gaps with Stephen W.Bigalow
1 × $6.00 -
×
 You Don't Need No Stinkin' Stockbroker: Taking the Pulse of Your Investment Portfolio with Doug Cappiello & Steve Tanaka
1 × $6.00
You Don't Need No Stinkin' Stockbroker: Taking the Pulse of Your Investment Portfolio with Doug Cappiello & Steve Tanaka
1 × $6.00 -
×
 FOUS4 with Cameron Fous
1 × $5.00
FOUS4 with Cameron Fous
1 × $5.00 -
×
 Marber on Markets – How to Make Money from Charts with Brian Marber
1 × $6.00
Marber on Markets – How to Make Money from Charts with Brian Marber
1 × $6.00 -
×
 The 1st Leveraged ETF Trading Strategies Workshop
1 × $54.00
The 1st Leveraged ETF Trading Strategies Workshop
1 × $54.00 -
×
 How To Develop A Winning Trading System That Fits You Home Study + Audio - 2020 with Van Tharp
1 × $62.00
How To Develop A Winning Trading System That Fits You Home Study + Audio - 2020 with Van Tharp
1 × $62.00 -
×
 Active Investing courses notes with Alan Hull
1 × $6.00
Active Investing courses notes with Alan Hull
1 × $6.00 -
×
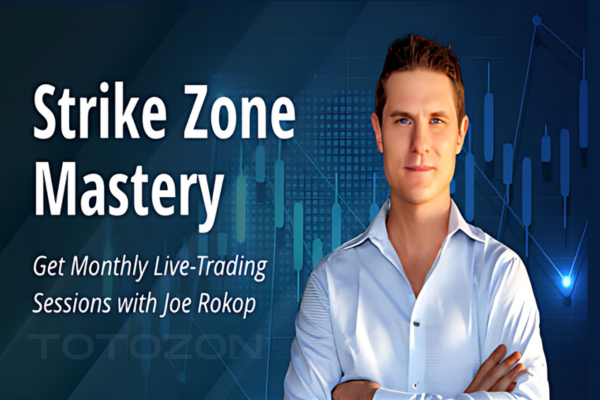 Strike Zone Strategy 2.0 Elite Package with Joe Rokop
1 × $39.00
Strike Zone Strategy 2.0 Elite Package with Joe Rokop
1 × $39.00 -
×
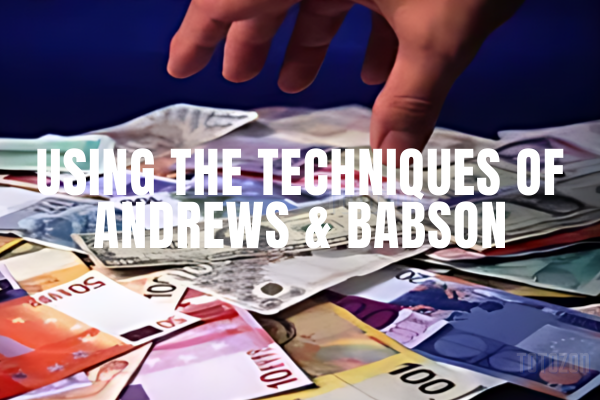 Using the Techniques of Andrews & Babson
1 × $6.00
Using the Techniques of Andrews & Babson
1 × $6.00 -
×
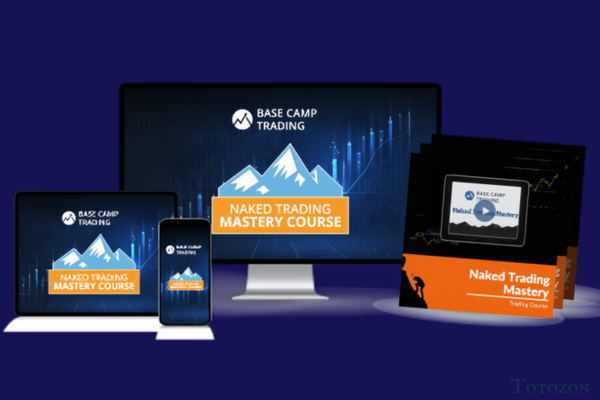 Naked Trading Mastery
1 × $39.00
Naked Trading Mastery
1 × $39.00 -
×
 New Generation Market Profile (May 2014)
1 × $15.00
New Generation Market Profile (May 2014)
1 × $15.00 -
×
 Market Maps. High Probability Trading Techniques with Timothy Morge
1 × $6.00
Market Maps. High Probability Trading Techniques with Timothy Morge
1 × $6.00 -
×
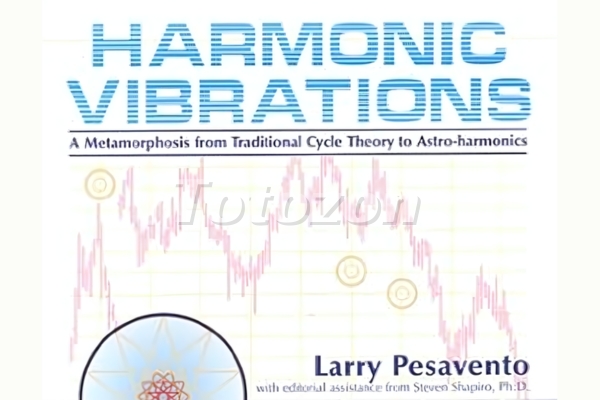 Harmonic Vibrations with Larry Pesavento
1 × $6.00
Harmonic Vibrations with Larry Pesavento
1 × $6.00 -
×
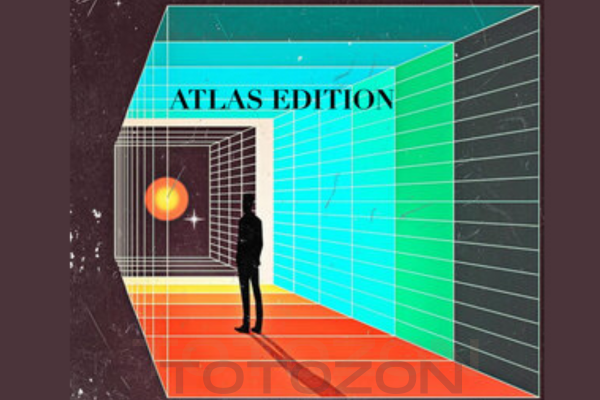 Atlas Edition Course with Apex Paragon Trading
1 × $6.00
Atlas Edition Course with Apex Paragon Trading
1 × $6.00 -
×
 Natural Squares Calculator with Lambert-Gann Educators
1 × $6.00
Natural Squares Calculator with Lambert-Gann Educators
1 × $6.00 -
×
 Beginners Guide To Technical Analysis with Henry Gambell
1 × $15.00
Beginners Guide To Technical Analysis with Henry Gambell
1 × $15.00 -
×
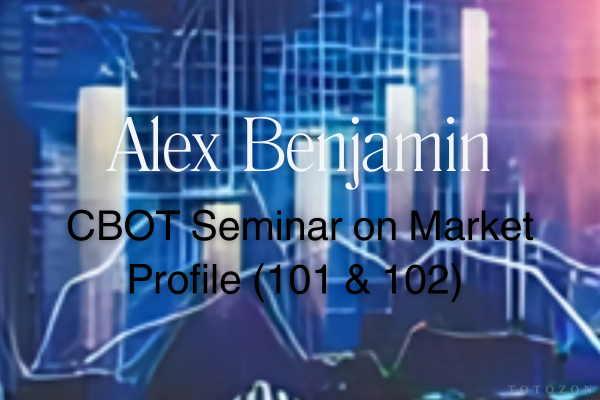 CBOT Seminar on Market Profile (101 & 102) with Alex Benjamin
1 × $6.00
CBOT Seminar on Market Profile (101 & 102) with Alex Benjamin
1 × $6.00 -
×
 The 2021 TraderLion Stock Trading Conference with Trader Lion
1 × $5.00
The 2021 TraderLion Stock Trading Conference with Trader Lion
1 × $5.00 -
×
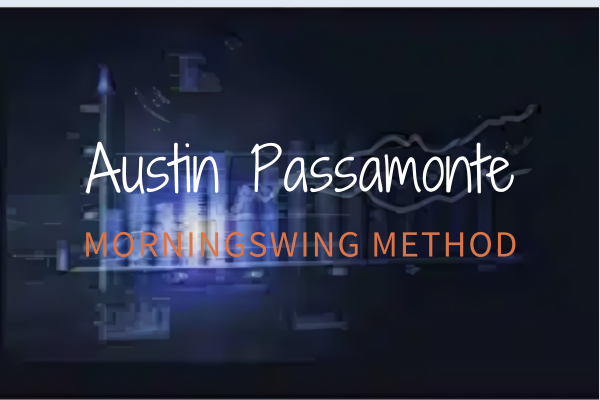 MorningSwing Method with Austin Passamonte
1 × $6.00
MorningSwing Method with Austin Passamonte
1 × $6.00 -
×
 Traders Secret Success Package. Symmetry Wave Trading with Michael Gur Dillon
1 × $6.00
Traders Secret Success Package. Symmetry Wave Trading with Michael Gur Dillon
1 × $6.00 -
×
 FXStreet Unrecorded Webinars Sept & Oct, 2011 with Sam Seiden
1 × $6.00
FXStreet Unrecorded Webinars Sept & Oct, 2011 with Sam Seiden
1 × $6.00 -
×
 Advanced Trading Course with Edney Pinheiro
1 × $5.00
Advanced Trading Course with Edney Pinheiro
1 × $5.00 -
×
 Oil Trading Academy Code 3 Video Course
1 × $6.00
Oil Trading Academy Code 3 Video Course
1 × $6.00 -
×
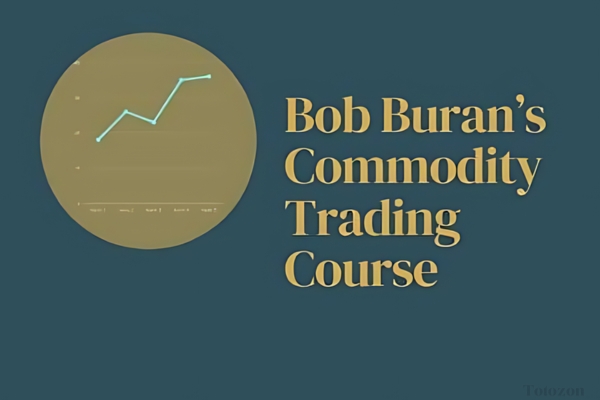 Commodity Trading Video Course with Bob Buran
1 × $6.00
Commodity Trading Video Course with Bob Buran
1 × $6.00 -
×
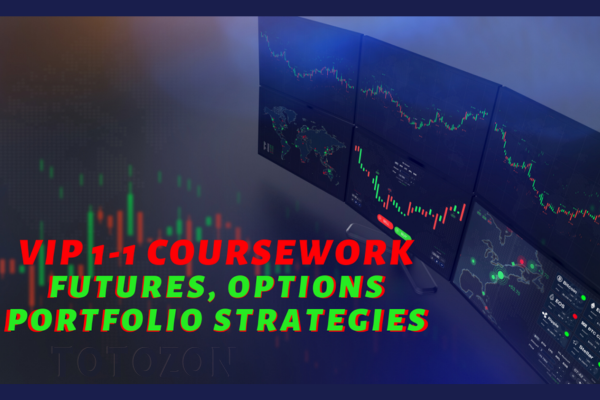 VIP - One on One Coursework with Talkin Options
1 × $15.00
VIP - One on One Coursework with Talkin Options
1 × $15.00 -
×
 Pristine - Cardinal Rules of Trading
1 × $6.00
Pristine - Cardinal Rules of Trading
1 × $6.00 -
×
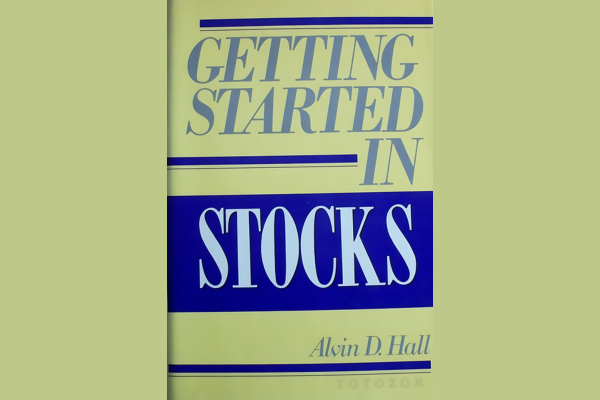 Getting Started in Stocks with Alvin D.Hall
1 × $6.00
Getting Started in Stocks with Alvin D.Hall
1 × $6.00 -
×
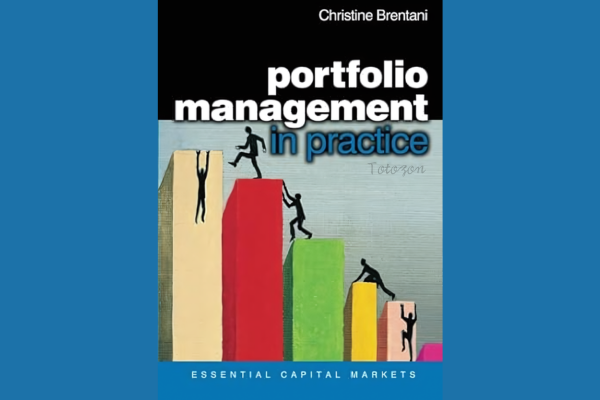 Portfolio Management in Practice with Christine Brentani
1 × $6.00
Portfolio Management in Practice with Christine Brentani
1 × $6.00 -
×
 Tick By Tick By Alphonso Esposito - TradeSmart
1 × $6.00
Tick By Tick By Alphonso Esposito - TradeSmart
1 × $6.00 -
×
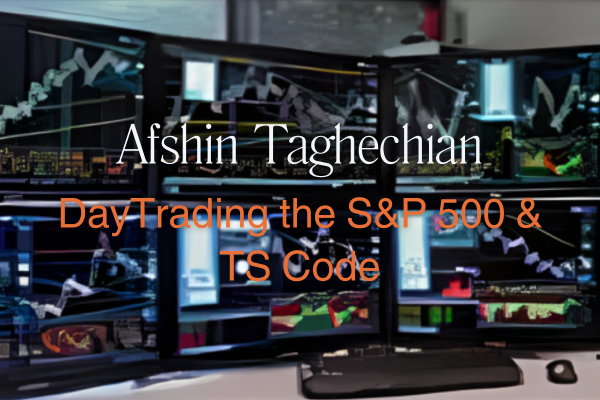 DayTrading the S&P 500 & TS Code with Afshin Taghechian
1 × $6.00
DayTrading the S&P 500 & TS Code with Afshin Taghechian
1 × $6.00 -
×
 Deep Dive Butterfly Trading Strategy Class with SJG Trades
1 × $41.00
Deep Dive Butterfly Trading Strategy Class with SJG Trades
1 × $41.00 -
×
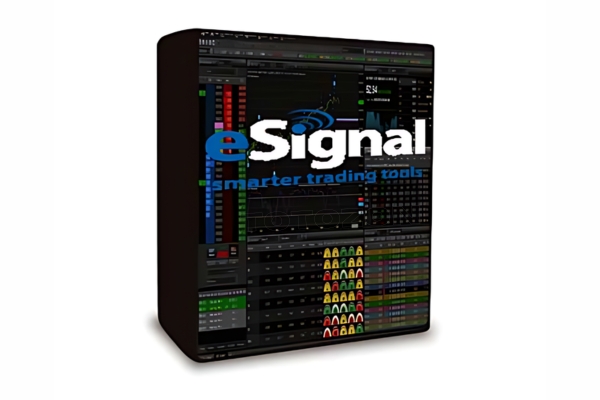 Teresa Lo's PowerSwings EOD for eSignal (powerswings.com)
1 × $6.00
Teresa Lo's PowerSwings EOD for eSignal (powerswings.com)
1 × $6.00 -
×
 Selling Options For A Living Class with Don Kaufman
1 × $6.00
Selling Options For A Living Class with Don Kaufman
1 × $6.00 -
×
 The STRAT Execution Basics with Jermaine McGruder
1 × $31.00
The STRAT Execution Basics with Jermaine McGruder
1 × $31.00 -
×
 Extreme Events: Robust Portfolio Construction in the Presence of Fat Tails with Malcolm Kemp
1 × $6.00
Extreme Events: Robust Portfolio Construction in the Presence of Fat Tails with Malcolm Kemp
1 × $6.00 -
×
 The 80% Solution S&P Systems with Bruce Babcock
1 × $6.00
The 80% Solution S&P Systems with Bruce Babcock
1 × $6.00 -
×
 Yes You Can Time the Market! with Ben Stein
1 × $6.00
Yes You Can Time the Market! with Ben Stein
1 × $6.00 -
×
 Forex Trading MasterClass with Torero Traders School
1 × $5.00
Forex Trading MasterClass with Torero Traders School
1 × $5.00 -
×
 Japanese Trading Systems with Tradesmart University
1 × $9.00
Japanese Trading Systems with Tradesmart University
1 × $9.00 -
×
 Option Greeks Class with Don Kaufman
1 × $6.00
Option Greeks Class with Don Kaufman
1 × $6.00 -
×
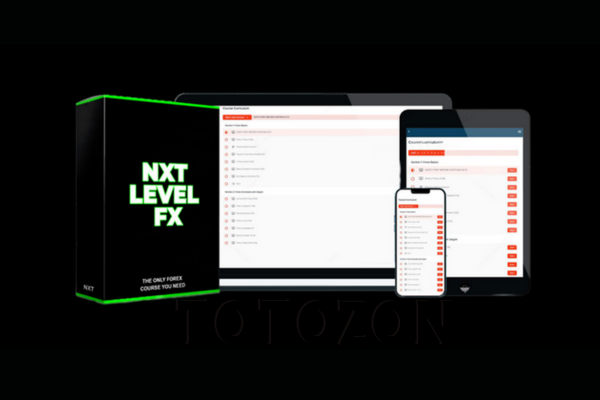 NXT Level FX with Investors Domain
1 × $5.00
NXT Level FX with Investors Domain
1 × $5.00 -
×
 Computational Financial Mathematics with Mathematica
1 × $6.00
Computational Financial Mathematics with Mathematica
1 × $6.00 -
×
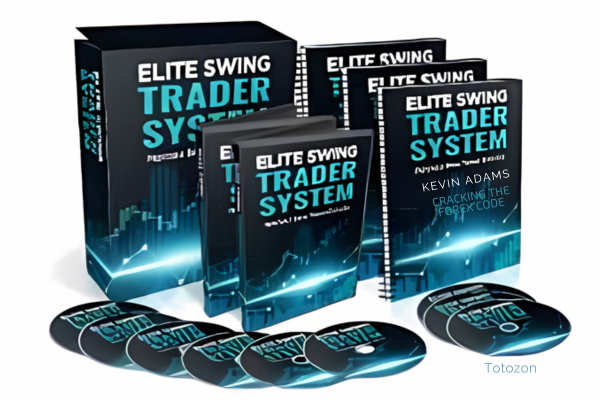 Cracking The Forex Code with Kevin Adams
1 × $6.00
Cracking The Forex Code with Kevin Adams
1 × $6.00 -
×
 Back to the Basics
1 × $6.00
Back to the Basics
1 × $6.00 -
×
 Forex Secrets Exposed
1 × $15.00
Forex Secrets Exposed
1 × $15.00 -
×
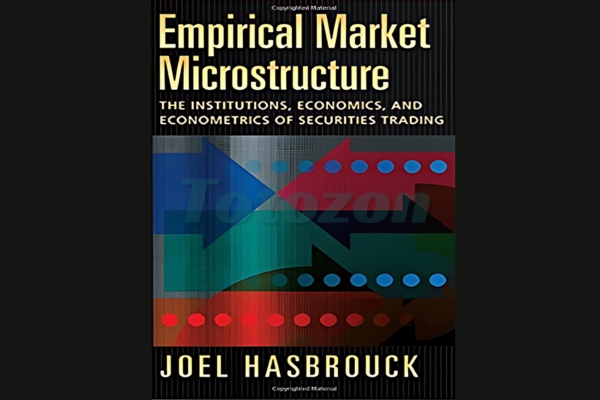 Empirical Market Microstructure
1 × $6.00
Empirical Market Microstructure
1 × $6.00 -
×
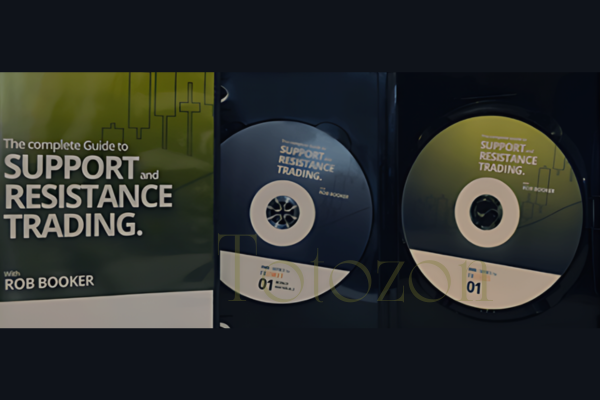 Support and Resistance Trading with Rob Booker
1 × $6.00
Support and Resistance Trading with Rob Booker
1 × $6.00 -
×
 Smart Money Concepts with JordyBanks
1 × $6.00
Smart Money Concepts with JordyBanks
1 × $6.00 -
×
 The Orderflows Trade Opportunities Encyclopedia with Michael Valtos
1 × $8.00
The Orderflows Trade Opportunities Encyclopedia with Michael Valtos
1 × $8.00

Reading & Understanding Charts with Andrew Baxter
$6.00
File Size: 311MB
Delivery Time: 1–12 hours
Media Type: Online Course
Content Proof: Watch Here!
You may check content proof of “Reading & Understanding Chartsb with Andrew Baxter” below:

Reading & Understanding Charts with Andrew Baxter
Introduction to Chart Reading
Charts are essential tools for traders, providing visual representations of market data. Andrew Baxter, a renowned trader and educator, shares his expertise on how to read and understand charts effectively. This article will guide you through the basics and advanced techniques of chart reading, helping you make informed trading decisions.
What are Trading Charts?
Definition and Purpose
Trading charts are graphical representations of price movements over time. They help traders analyze trends, identify patterns, and make predictions about future price movements.
Importance of Chart Reading
Understanding charts is crucial for making data-driven decisions in trading. It reduces emotional trading and enhances your ability to spot opportunities and risks.
Types of Trading Charts
1. Line Charts
Line charts are the simplest form of trading charts, showing the closing prices over a period. They provide a clear view of the overall trend but lack detailed information.
2. Bar Charts
Bar charts display the opening, closing, high, and low prices for each period. They offer more information than line charts and help in understanding price volatility.
3. Candlestick Charts
Candlestick charts are popular due to their detailed and visually appealing format. Each candlestick shows the opening, closing, high, and low prices, making it easier to identify market sentiment.
Understanding Candlestick Charts
Components of a Candlestick
- Body: The filled part showing the opening and closing prices.
- Wicks/Shadows: The thin lines representing the high and low prices.
- Color: Indicates whether the closing price was higher (typically green) or lower (typically red) than the opening price.
Common Candlestick Patterns
1. Doji
A Doji occurs when the opening and closing prices are nearly the same, indicating indecision in the market.
2. Hammer
A Hammer has a small body with a long lower wick, suggesting a potential reversal from a downtrend.
3. Engulfing Pattern
An Engulfing pattern occurs when a larger candlestick completely engulfs the previous smaller candlestick, signaling a potential reversal.
Key Chart Patterns
1. Head and Shoulders
This pattern indicates a reversal and is formed by a peak (head) flanked by two smaller peaks (shoulders).
2. Double Top and Double Bottom
These patterns signal a potential reversal. A double top indicates a bearish reversal, while a double bottom suggests a bullish reversal.
3. Triangles
Triangles are continuation patterns that show a period of consolidation before the price continues in the direction of the previous trend.
Using Technical Indicators
1. Moving Averages
Moving averages smooth out price data to identify trends. Common types include Simple Moving Average (SMA) and Exponential Moving Average (EMA).
2. Relative Strength Index (RSI)
RSI measures the speed and change of price movements, indicating overbought or oversold conditions.
3. Moving Average Convergence Divergence (MACD)
MACD shows the relationship between two moving averages, helping to identify potential buy and sell signals.
Combining Chart Patterns and Indicators
Integrated Analysis
Combining chart patterns with technical indicators enhances the reliability of trading signals. For example, confirming a head and shoulders pattern with RSI divergence can provide a stronger signal.
Practical Application
Use a combination of patterns and indicators to develop a comprehensive trading strategy. This approach helps in making more informed and confident trading decisions.
Advanced Chart Reading Techniques
1. Fibonacci Retracement
Fibonacci retracement levels indicate potential support and resistance levels based on the Fibonacci sequence.
2. Volume Analysis
Volume analysis involves examining the number of shares traded to confirm the strength of a price movement or trend.
3. Divergence
Divergence occurs when the price moves in the opposite direction of an indicator, signaling a potential reversal.
Common Mistakes in Chart Reading
1. Overcomplicating Analysis
Avoid using too many indicators and patterns at once. Focus on a few reliable tools to keep your analysis clear and effective.
2. Ignoring Context
Always consider the broader market context and economic factors. Relying solely on charts without context can lead to misleading conclusions.
3. Emotional Trading
Stick to your analysis and avoid making decisions based on emotions. Emotional trading can undermine even the best chart reading skills.
Benefits of Mastering Chart Reading
1. Improved Decision Making
Accurate chart reading helps you make informed decisions, reducing the risk of losses and increasing the potential for gains.
2. Enhanced Trading Strategy
Understanding charts allows you to develop and refine your trading strategies, making them more effective and adaptable.
3. Increased Confidence
With better chart reading skills, you gain confidence in your trading decisions, leading to more consistent performance.
Conclusion
Reading and understanding charts with insights from Andrew Baxter can significantly improve your trading performance. By mastering various chart types, patterns, and technical indicators, you can make more informed decisions and develop robust trading strategies. Embrace these principles, continuously practice, and refine your skills to become a proficient trader.
Frequently Asked Questions:
What are the main types of trading charts?
The main types are line charts, bar charts, and candlestick charts.
Why are candlestick charts popular?
Candlestick charts are popular due to their detailed and visually appealing format, making it easier to identify market sentiment.
What are some common candlestick patterns?
Common patterns include Doji, Hammer, and Engulfing patterns.
How can technical indicators enhance chart reading?
Technical indicators like moving averages, RSI, and MACD help identify trends, momentum, and potential buy/sell signals.
What are some advanced chart reading techniques?
Advanced techniques include Fibonacci retracement, volume analysis, and divergence.
Be the first to review “Reading & Understanding Charts with Andrew Baxter”
You must be logged in to post a review.
Related products

Original price was: $197.00.$5.00Current price is: $5.00.
Original price was: $299.00.$8.00Current price is: $8.00.

Forex Trading
Original price was: $2,995.00.$31.00Current price is: $31.00.
Forex Trading
Original price was: $2,997.00.$23.00Current price is: $23.00.
Forex Trading
Original price was: $1,898.00.$10.00Current price is: $10.00.

Forex Trading
The Complete Guide to Multiple Time Frame Analysis & Reading Price Action with Aiman Almansoori
Original price was: $1,399.00.$13.00Current price is: $13.00.

Forex Trading
Original price was: $2,000.00.$23.00Current price is: $23.00.

Forex Trading
Original price was: $397.00.$31.00Current price is: $31.00.

Forex Trading
Original price was: $550.00.$5.00Current price is: $5.00.

Original price was: $1,200.00.$23.00Current price is: $23.00.

Original price was: $700.00.$39.00Current price is: $39.00.

Original price was: $895.00.$15.00Current price is: $15.00.

Original price was: $450.00.$23.00Current price is: $23.00.

Forex Trading
Original price was: $797.00.$10.00Current price is: $10.00.
Original price was: $497.00.$31.00Current price is: $31.00.

Forex Trading
Quantamentals – The Next Great Forefront Of Trading and Investing with Trading Markets
Original price was: $1,495.00.$8.00Current price is: $8.00.

Forex Trading
Original price was: $499.00.$15.00Current price is: $15.00.

Original price was: $4,995.00.$15.00Current price is: $15.00.

Forex Trading
Original price was: $125.00.$17.00Current price is: $17.00.

Forex Trading
Original price was: $249.00.$15.00Current price is: $15.00.

Reviews
There are no reviews yet.