-
×
 Day One Trader with John Sussex
1 × $6.00
Day One Trader with John Sussex
1 × $6.00 -
×
 ActiveBeta Indexes. Capturing Systematic Sources of Active Equity Returns (HTML) with Andrew Lo
1 × $6.00
ActiveBeta Indexes. Capturing Systematic Sources of Active Equity Returns (HTML) with Andrew Lo
1 × $6.00 -
×
 Freedom Challenge Course with Steven Dux
1 × $5.00
Freedom Challenge Course with Steven Dux
1 × $5.00 -
×
 Profits in the Stock Market with Harold Gartley
1 × $6.00
Profits in the Stock Market with Harold Gartley
1 × $6.00 -
×
 Crystal Ball Pack PLUS bonus Live Trade By Pat Mitchell - Trick Trades
1 × $20.00
Crystal Ball Pack PLUS bonus Live Trade By Pat Mitchell - Trick Trades
1 × $20.00 -
×
 Forecast, Filings, & News with Jtrader
1 × $6.00
Forecast, Filings, & News with Jtrader
1 × $6.00 -
×
 The 4 Horsemen CD with David Elliott
1 × $6.00
The 4 Horsemen CD with David Elliott
1 × $6.00 -
×
 How the Stock Market Works with Ramon DeGennaro
1 × $5.00
How the Stock Market Works with Ramon DeGennaro
1 × $5.00 -
×
 Trading as a Business with Alexander Elder
1 × $6.00
Trading as a Business with Alexander Elder
1 × $6.00 -
×
 Equity Valuation for Analysts and Investors: A Unique Stock Valuation Tool for Financial Statement Analysis and Model-Building with James Kelleher
1 × $6.00
Equity Valuation for Analysts and Investors: A Unique Stock Valuation Tool for Financial Statement Analysis and Model-Building with James Kelleher
1 × $6.00 -
×
 Sure Fire Forex Trading with Mark McRae
1 × $6.00
Sure Fire Forex Trading with Mark McRae
1 × $6.00 -
×
 Profit Power Seminar
1 × $23.00
Profit Power Seminar
1 × $23.00 -
×
 The Complete Guide to Multiple Time Frame Analysis & Reading Price Action with Aiman Almansoori
1 × $13.00
The Complete Guide to Multiple Time Frame Analysis & Reading Price Action with Aiman Almansoori
1 × $13.00 -
×
 Derivates Demystified
1 × $6.00
Derivates Demystified
1 × $6.00 -
×
 SQX Mentorship with Tip Toe Hippo
1 × $23.00
SQX Mentorship with Tip Toe Hippo
1 × $23.00 -
×
 Getting New Insights from Old Indicators with Martin Pring
1 × $6.00
Getting New Insights from Old Indicators with Martin Pring
1 × $6.00 -
×
 Traders Winning Edge with Adrienne Laris Toghraie
1 × $6.00
Traders Winning Edge with Adrienne Laris Toghraie
1 × $6.00 -
×
 Get to know the VIX Index (aka The Fear Index)
1 × $15.00
Get to know the VIX Index (aka The Fear Index)
1 × $15.00 -
×
 Four Dimensional Stock Market Structures & Cycles with Bradley Cowan
1 × $6.00
Four Dimensional Stock Market Structures & Cycles with Bradley Cowan
1 × $6.00 -
×
 Advanced Strategies in Forex Trading with Don Schellenberg
1 × $6.00
Advanced Strategies in Forex Trading with Don Schellenberg
1 × $6.00 -
×
 The Orderflow Masterclass with PrimeTrading
1 × $17.00
The Orderflow Masterclass with PrimeTrading
1 × $17.00 -
×
 Scalp Strategy and Flipping Small Accounts with Opes Trading Group
1 × $5.00
Scalp Strategy and Flipping Small Accounts with Opes Trading Group
1 × $5.00 -
×
 7 Day FX Mastery Course with Market Masters
1 × $6.00
7 Day FX Mastery Course with Market Masters
1 × $6.00 -
×
 A Course in Trading with Donald Mack & Wetsel Market Bureau
1 × $6.00
A Course in Trading with Donald Mack & Wetsel Market Bureau
1 × $6.00 -
×
 Profit Before Work System with John Piper
1 × $6.00
Profit Before Work System with John Piper
1 × $6.00 -
×
 Home Run Options Trading Course with Dave Aquino - Base Camp Trading
1 × $11.00
Home Run Options Trading Course with Dave Aquino - Base Camp Trading
1 × $11.00 -
×
 X-Factor Day-Trading
1 × $5.00
X-Factor Day-Trading
1 × $5.00 -
×
 Divorcing the Dow: Using Revolutionary Market Indicators to Profit from the Stealth Boom Ahead - Jim Troup & Sharon Michalsky
1 × $6.00
Divorcing the Dow: Using Revolutionary Market Indicators to Profit from the Stealth Boom Ahead - Jim Troup & Sharon Michalsky
1 × $6.00 -
×
 D5 Render Course with Nuno Silva
1 × $27.00
D5 Render Course with Nuno Silva
1 × $27.00 -
×
 The Aggressive Investor. Case Studies with Colin Nicholson
1 × $6.00
The Aggressive Investor. Case Studies with Colin Nicholson
1 × $6.00 -
×
 Synthetic and Structured Assets: A Practical Guide to Investment and Risk with Erik Banks
1 × $6.00
Synthetic and Structured Assets: A Practical Guide to Investment and Risk with Erik Banks
1 × $6.00 -
×
 Traders Secret Library
1 × $6.00
Traders Secret Library
1 × $6.00 -
×
 T3 Live - The Simple Art of Trading
1 × $31.00
T3 Live - The Simple Art of Trading
1 × $31.00 -
×
 5 Day Program with Dimitri Wallace - Gold Minds Global
1 × $6.00
5 Day Program with Dimitri Wallace - Gold Minds Global
1 × $6.00 -
×
 Algo Trading Masterclass with Ali Casey - StatOasis
1 × $23.00
Algo Trading Masterclass with Ali Casey - StatOasis
1 × $23.00 -
×
 30 Day Masterclass with Joe Elite Trader Hub ICT
1 × $6.00
30 Day Masterclass with Joe Elite Trader Hub ICT
1 × $6.00 -
×
 Dynamic Time Cycles with Peter Eliades
1 × $6.00
Dynamic Time Cycles with Peter Eliades
1 × $6.00 -
×
 Acclimation Course with Base Camp Trading
1 × $10.00
Acclimation Course with Base Camp Trading
1 × $10.00 -
×
 TradeCraft: Your Path to Peak Performance Trading By Adam Grimes
1 × $15.00
TradeCraft: Your Path to Peak Performance Trading By Adam Grimes
1 × $15.00 -
×
 RiskDoctor RD2 – Intermediate Course to Options Trading the RiskDoctor Way - Charles Cottle
1 × $6.00
RiskDoctor RD2 – Intermediate Course to Options Trading the RiskDoctor Way - Charles Cottle
1 × $6.00 -
×
 Stock Market Wizards Interviews with America’s Top Stock Traders - Jack Schwager
1 × $6.00
Stock Market Wizards Interviews with America’s Top Stock Traders - Jack Schwager
1 × $6.00 -
×
 Traders Secret Code Complete Course with Mark McRae
1 × $6.00
Traders Secret Code Complete Course with Mark McRae
1 × $6.00 -
×
 Forex Project Advanced Course with Tyler Crowell
1 × $5.00
Forex Project Advanced Course with Tyler Crowell
1 × $5.00 -
×
 Elliott Wave Indicator Suite for ThinkorSwim
1 × $15.00
Elliott Wave Indicator Suite for ThinkorSwim
1 × $15.00 -
×
 TECHNICAL ANALYSIS MODULE
1 × $6.00
TECHNICAL ANALYSIS MODULE
1 × $6.00 -
×
 Star Traders Forex Intermediate Course I with Karen Foo
1 × $8.00
Star Traders Forex Intermediate Course I with Karen Foo
1 × $8.00 -
×
 Active Investment Management: Finding and Harnessing Investment Skill with Charles Jackson
1 × $6.00
Active Investment Management: Finding and Harnessing Investment Skill with Charles Jackson
1 × $6.00 -
×
 Matrix Options
1 × $6.00
Matrix Options
1 × $6.00 -
×
 Crypto Trading Academy with Cheeky Investor - Aussie Day Trader
1 × $13.00
Crypto Trading Academy with Cheeky Investor - Aussie Day Trader
1 × $13.00 -
×
 The Scalper’s Boot Camp (Sep 2011)
1 × $23.00
The Scalper’s Boot Camp (Sep 2011)
1 × $23.00 -
×
 The Ultimate Trading Resource with Clayton Bell, Alex Viscusi & Ben Chaffee
1 × $6.00
The Ultimate Trading Resource with Clayton Bell, Alex Viscusi & Ben Chaffee
1 × $6.00 -
×
 LARGE CAP MOMENTUM STRATEGY with Nick Radge
1 × $179.00
LARGE CAP MOMENTUM STRATEGY with Nick Radge
1 × $179.00 -
×
 The All Put Flat Butterfly with Dan Sheridan - Sheridan Options Mentoring
1 × $6.00
The All Put Flat Butterfly with Dan Sheridan - Sheridan Options Mentoring
1 × $6.00 -
×
 A Complete Course in Option Trading Fundamentals with Joseph Frey
1 × $6.00
A Complete Course in Option Trading Fundamentals with Joseph Frey
1 × $6.00 -
×
 The Beginners Guide to Commodities Investing with Brian & Gayle Rice
1 × $6.00
The Beginners Guide to Commodities Investing with Brian & Gayle Rice
1 × $6.00 -
×
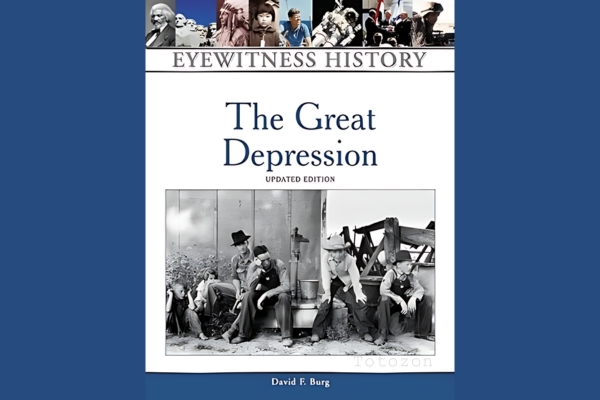 The Great Depression with David Burg
1 × $6.00
The Great Depression with David Burg
1 × $6.00 -
×
 Passages To Profitability: A Comprehensive Guide To Channel Trading with Professor Jeff Bierman, CMT
1 × $6.00
Passages To Profitability: A Comprehensive Guide To Channel Trading with Professor Jeff Bierman, CMT
1 × $6.00 -
×
 Sea Lanes & Pipelines with Bernard D.Cole
1 × $6.00
Sea Lanes & Pipelines with Bernard D.Cole
1 × $6.00 -
×
 The Internet Trading Course with Alpesh Patel
1 × $6.00
The Internet Trading Course with Alpesh Patel
1 × $6.00 -
×
 The Best of the Professional Traders Journal. Market Timing with Larry Connors
1 × $6.00
The Best of the Professional Traders Journal. Market Timing with Larry Connors
1 × $6.00 -
×
 The Indices Orderflow Masterclass with The Forex Scalpers
1 × $23.00
The Indices Orderflow Masterclass with The Forex Scalpers
1 × $23.00 -
×
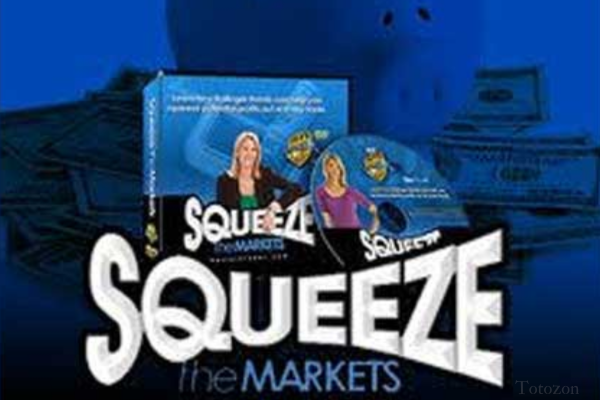 Squeeze the Markets with Markay Latimer
1 × $6.00
Squeeze the Markets with Markay Latimer
1 × $6.00 -
×
 The Telecoms Trade War with Mark Naftel
1 × $6.00
The Telecoms Trade War with Mark Naftel
1 × $6.00 -
×
 5-Week Portfolio (No Bonus) - Criticaltrading
1 × $39.00
5-Week Portfolio (No Bonus) - Criticaltrading
1 × $39.00 -
×
 Candlestick Patterns to Master Forex Trading Price Action with Federico Sellitti
1 × $6.00
Candlestick Patterns to Master Forex Trading Price Action with Federico Sellitti
1 × $6.00 -
×
 Crash Profits Make Money When Stocks Sink and Soar with Martin D.Weiss
1 × $6.00
Crash Profits Make Money When Stocks Sink and Soar with Martin D.Weiss
1 × $6.00 -
×
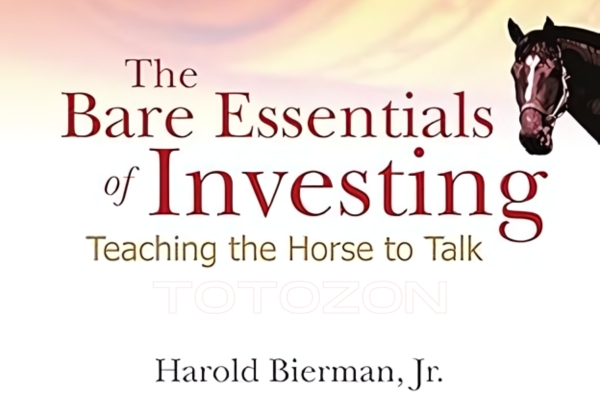 The Bare Essentials Of Investing: Teaching The Horse To Talk with Harold Bierman
1 × $6.00
The Bare Essentials Of Investing: Teaching The Horse To Talk with Harold Bierman
1 × $6.00 -
×
 TradeGuider Education Package
1 × $54.00
TradeGuider Education Package
1 × $54.00 -
×
 Code 6 + 7 Course with Oil Trading Academy
1 × $41.00
Code 6 + 7 Course with Oil Trading Academy
1 × $41.00 -
×
 A Non-Random Walk Down Wall Street with Andrew W.Lo
1 × $6.00
A Non-Random Walk Down Wall Street with Andrew W.Lo
1 × $6.00 -
×
 Forex Master Method Evolution with Russ Horn
1 × $6.00
Forex Master Method Evolution with Russ Horn
1 × $6.00 -
×
 ICT Prodigy Trading Course – $650K in Payouts with Alex Solignani
1 × $15.00
ICT Prodigy Trading Course – $650K in Payouts with Alex Solignani
1 × $15.00 -
×
 Harmonic Elliott Wave: The Case for Modification of R. N. Elliott's Impulsive Wave Structure with Ian Copsey
1 × $6.00
Harmonic Elliott Wave: The Case for Modification of R. N. Elliott's Impulsive Wave Structure with Ian Copsey
1 × $6.00 -
×
 Market Masters. How Traders Think Trade And Invest with Jake Bernstein
1 × $6.00
Market Masters. How Traders Think Trade And Invest with Jake Bernstein
1 × $6.00 -
×
 The 30-Day Cash Flow Blueprint with Andy Tanner
1 × $31.00
The 30-Day Cash Flow Blueprint with Andy Tanner
1 × $31.00 -
×
 The Day Trader: From the Pit to the PC with Lewis Borsellino
1 × $6.00
The Day Trader: From the Pit to the PC with Lewis Borsellino
1 × $6.00 -
×
 The Cycles and The Codes with Myles Wilson-Walker
1 × $15.00
The Cycles and The Codes with Myles Wilson-Walker
1 × $15.00 -
×
 Trade with a Day Job USA v2010 with Markets Mastered
1 × $6.00
Trade with a Day Job USA v2010 with Markets Mastered
1 × $6.00 -
×
 ProfileTraders - Swing and Price Analysis (May 2014)
1 × $6.00
ProfileTraders - Swing and Price Analysis (May 2014)
1 × $6.00 -
×
 Keynes & The Market with Justyn Walsh
1 × $6.00
Keynes & The Market with Justyn Walsh
1 × $6.00 -
×
 A Game Plan for Investing in the 21st Century with Thomas J.Dorsey
1 × $6.00
A Game Plan for Investing in the 21st Century with Thomas J.Dorsey
1 × $6.00 -
×
 The Crypto Code with Joel Peterson - Adam Short
1 × $15.00
The Crypto Code with Joel Peterson - Adam Short
1 × $15.00 -
×
 The Reducing Risk and Maximizing Returns Blueprint (Atomic Hedge Strategy) with Don Kaufman
1 × $6.00
The Reducing Risk and Maximizing Returns Blueprint (Atomic Hedge Strategy) with Don Kaufman
1 × $6.00 -
×
 The Deadly 7 Sins of Investing with Maury Fertig
1 × $6.00
The Deadly 7 Sins of Investing with Maury Fertig
1 × $6.00 -
×
 Super Conference 2020 - Premier Coaching Package with Vince Vora
1 × $109.00
Super Conference 2020 - Premier Coaching Package with Vince Vora
1 × $109.00 -
×
 All About High-Frequency Trading with Michael Durbin
1 × $6.00
All About High-Frequency Trading with Michael Durbin
1 × $6.00 -
×
 Mapping the Markets: A Guide to Stock Market Analysis with Deborah Owen & Robin Griffiths
1 × $6.00
Mapping the Markets: A Guide to Stock Market Analysis with Deborah Owen & Robin Griffiths
1 × $6.00 -
×
 How to Collect Income Being Short with Don Kaufman
1 × $6.00
How to Collect Income Being Short with Don Kaufman
1 × $6.00 -
×
 Asset Prices, Booms & Recessions (2nd Ed.) with Willi Semmler
1 × $6.00
Asset Prices, Booms & Recessions (2nd Ed.) with Willi Semmler
1 × $6.00 -
×
 Simpler Traders - Ultimate Guide to Debit Spreads (PREMIUM)
1 × $39.00
Simpler Traders - Ultimate Guide to Debit Spreads (PREMIUM)
1 × $39.00 -
×
 Essential Stock Picking Strategies with Daniel Strachman
1 × $6.00
Essential Stock Picking Strategies with Daniel Strachman
1 × $6.00 -
×
 Simpler Options - Insider’s Guide to Generating Income using Options Strategies Course (Oct 2014)
1 × $6.00
Simpler Options - Insider’s Guide to Generating Income using Options Strategies Course (Oct 2014)
1 × $6.00 -
×
 Professor Jeff Bierman's 15 Class Bundle (The Professor's Package)
1 × $6.00
Professor Jeff Bierman's 15 Class Bundle (The Professor's Package)
1 × $6.00 -
×
 Floor Traders Edge Mentorship Program with Market Geeks
1 × $6.00
Floor Traders Edge Mentorship Program with Market Geeks
1 × $6.00 -
×
 Sacredscience - W.F.Whitehead – Occultism Simplified
1 × $6.00
Sacredscience - W.F.Whitehead – Occultism Simplified
1 × $6.00 -
×
 Day Trading Smart Right From the Start: Trading Essentials for Maximum Results - David Nassar & John Boyer
1 × $6.00
Day Trading Smart Right From the Start: Trading Essentials for Maximum Results - David Nassar & John Boyer
1 × $6.00 -
×
 Electronic Day Traders' Secrets: Learn From the Best of the Best DayTraders with Burton Friedfertig
1 × $6.00
Electronic Day Traders' Secrets: Learn From the Best of the Best DayTraders with Burton Friedfertig
1 × $6.00 -
×
 $20 – 52k 20 pips a day challange with Rafał Zuchowicz - TopMasterTrader
1 × $5.00
$20 – 52k 20 pips a day challange with Rafał Zuchowicz - TopMasterTrader
1 × $5.00 -
×
 Compass Trading System with Right Line Trading
1 × $39.00
Compass Trading System with Right Line Trading
1 × $39.00 -
×
 Examination Morning Session – Essay (2003) with CFA Level 3
1 × $6.00
Examination Morning Session – Essay (2003) with CFA Level 3
1 × $6.00 -
×
 Core Strategy Program + Extended Learning Track with Ota Courses
1 × $124.00
Core Strategy Program + Extended Learning Track with Ota Courses
1 × $124.00 -
×
 Advanced Spread Trading with Guy Bower - MasterClass Trader
1 × $15.00
Advanced Spread Trading with Guy Bower - MasterClass Trader
1 × $15.00 -
×
 How to Buy Stocks Before They Skyrocket
1 × $6.00
How to Buy Stocks Before They Skyrocket
1 × $6.00 -
×
 Startup Trading Masterclass with Jack Gleason
1 × $93.00
Startup Trading Masterclass with Jack Gleason
1 × $93.00 -
×
 High Probability Trading Using Elliott Wave And Fibonacci Analysis withVic Patel - Forex Training Group
1 × $10.00
High Probability Trading Using Elliott Wave And Fibonacci Analysis withVic Patel - Forex Training Group
1 × $10.00

Reading & Understanding Charts with Andrew Baxter
$6.00
File Size: 311MB
Delivery Time: 1–12 hours
Media Type: Online Course
Content Proof: Watch Here!
You may check content proof of “Reading & Understanding Chartsb with Andrew Baxter” below:

Reading & Understanding Charts with Andrew Baxter
Introduction to Chart Reading
Charts are essential tools for traders, providing visual representations of market data. Andrew Baxter, a renowned trader and educator, shares his expertise on how to read and understand charts effectively. This article will guide you through the basics and advanced techniques of chart reading, helping you make informed trading decisions.
What are Trading Charts?
Definition and Purpose
Trading charts are graphical representations of price movements over time. They help traders analyze trends, identify patterns, and make predictions about future price movements.
Importance of Chart Reading
Understanding charts is crucial for making data-driven decisions in trading. It reduces emotional trading and enhances your ability to spot opportunities and risks.
Types of Trading Charts
1. Line Charts
Line charts are the simplest form of trading charts, showing the closing prices over a period. They provide a clear view of the overall trend but lack detailed information.
2. Bar Charts
Bar charts display the opening, closing, high, and low prices for each period. They offer more information than line charts and help in understanding price volatility.
3. Candlestick Charts
Candlestick charts are popular due to their detailed and visually appealing format. Each candlestick shows the opening, closing, high, and low prices, making it easier to identify market sentiment.
Understanding Candlestick Charts
Components of a Candlestick
- Body: The filled part showing the opening and closing prices.
- Wicks/Shadows: The thin lines representing the high and low prices.
- Color: Indicates whether the closing price was higher (typically green) or lower (typically red) than the opening price.
Common Candlestick Patterns
1. Doji
A Doji occurs when the opening and closing prices are nearly the same, indicating indecision in the market.
2. Hammer
A Hammer has a small body with a long lower wick, suggesting a potential reversal from a downtrend.
3. Engulfing Pattern
An Engulfing pattern occurs when a larger candlestick completely engulfs the previous smaller candlestick, signaling a potential reversal.
Key Chart Patterns
1. Head and Shoulders
This pattern indicates a reversal and is formed by a peak (head) flanked by two smaller peaks (shoulders).
2. Double Top and Double Bottom
These patterns signal a potential reversal. A double top indicates a bearish reversal, while a double bottom suggests a bullish reversal.
3. Triangles
Triangles are continuation patterns that show a period of consolidation before the price continues in the direction of the previous trend.
Using Technical Indicators
1. Moving Averages
Moving averages smooth out price data to identify trends. Common types include Simple Moving Average (SMA) and Exponential Moving Average (EMA).
2. Relative Strength Index (RSI)
RSI measures the speed and change of price movements, indicating overbought or oversold conditions.
3. Moving Average Convergence Divergence (MACD)
MACD shows the relationship between two moving averages, helping to identify potential buy and sell signals.
Combining Chart Patterns and Indicators
Integrated Analysis
Combining chart patterns with technical indicators enhances the reliability of trading signals. For example, confirming a head and shoulders pattern with RSI divergence can provide a stronger signal.
Practical Application
Use a combination of patterns and indicators to develop a comprehensive trading strategy. This approach helps in making more informed and confident trading decisions.
Advanced Chart Reading Techniques
1. Fibonacci Retracement
Fibonacci retracement levels indicate potential support and resistance levels based on the Fibonacci sequence.
2. Volume Analysis
Volume analysis involves examining the number of shares traded to confirm the strength of a price movement or trend.
3. Divergence
Divergence occurs when the price moves in the opposite direction of an indicator, signaling a potential reversal.
Common Mistakes in Chart Reading
1. Overcomplicating Analysis
Avoid using too many indicators and patterns at once. Focus on a few reliable tools to keep your analysis clear and effective.
2. Ignoring Context
Always consider the broader market context and economic factors. Relying solely on charts without context can lead to misleading conclusions.
3. Emotional Trading
Stick to your analysis and avoid making decisions based on emotions. Emotional trading can undermine even the best chart reading skills.
Benefits of Mastering Chart Reading
1. Improved Decision Making
Accurate chart reading helps you make informed decisions, reducing the risk of losses and increasing the potential for gains.
2. Enhanced Trading Strategy
Understanding charts allows you to develop and refine your trading strategies, making them more effective and adaptable.
3. Increased Confidence
With better chart reading skills, you gain confidence in your trading decisions, leading to more consistent performance.
Conclusion
Reading and understanding charts with insights from Andrew Baxter can significantly improve your trading performance. By mastering various chart types, patterns, and technical indicators, you can make more informed decisions and develop robust trading strategies. Embrace these principles, continuously practice, and refine your skills to become a proficient trader.
Frequently Asked Questions:
What are the main types of trading charts?
The main types are line charts, bar charts, and candlestick charts.
Why are candlestick charts popular?
Candlestick charts are popular due to their detailed and visually appealing format, making it easier to identify market sentiment.
What are some common candlestick patterns?
Common patterns include Doji, Hammer, and Engulfing patterns.
How can technical indicators enhance chart reading?
Technical indicators like moving averages, RSI, and MACD help identify trends, momentum, and potential buy/sell signals.
What are some advanced chart reading techniques?
Advanced techniques include Fibonacci retracement, volume analysis, and divergence.
Be the first to review “Reading & Understanding Charts with Andrew Baxter”
You must be logged in to post a review.
Related products
Forex Trading
Original price was: $1,098.00.$39.00Current price is: $39.00.
Original price was: $197.00.$5.00Current price is: $5.00.

Forex Trading
Original price was: $249.00.$15.00Current price is: $15.00.

Forex Trading
Quantamentals – The Next Great Forefront Of Trading and Investing with Trading Markets
Original price was: $1,495.00.$8.00Current price is: $8.00.
Original price was: $895.00.$15.00Current price is: $15.00.
Original price was: $997.00.$13.00Current price is: $13.00.

Forex Trading
Original price was: $500.00.$5.00Current price is: $5.00.
Original price was: $649.00.$20.00Current price is: $20.00.

Original price was: $700.00.$39.00Current price is: $39.00.

Original price was: $1,800.00.$54.00Current price is: $54.00.
Original price was: $999.00.$5.00Current price is: $5.00.

Original price was: $695.00.$41.00Current price is: $41.00.

Forex Trading
Original price was: $239.00.$8.00Current price is: $8.00.
Original price was: $497.00.$11.00Current price is: $11.00.

Original price was: $139.00.$23.00Current price is: $23.00.
Forex Trading
Original price was: $2,997.00.$23.00Current price is: $23.00.

Forex Trading
Original price was: $397.00.$31.00Current price is: $31.00.
Forex Trading
Original price was: $125.00.$17.00Current price is: $17.00.

Forex Trading
Original price was: $4,997.00.$27.00Current price is: $27.00.

Forex Trading
Original price was: $697.00.$5.00Current price is: $5.00.

Reviews
There are no reviews yet.