-
×
 The Prop Trading Code with Brannigan Barrett - Axia Futures
1 × $23.00
The Prop Trading Code with Brannigan Barrett - Axia Futures
1 × $23.00 -
×
 Sell Premium & Minimize Risk Class with Don Kaufman
1 × $6.00
Sell Premium & Minimize Risk Class with Don Kaufman
1 × $6.00 -
×
 Examination Morning Session – Essay (2003) with CFA Level 3
1 × $6.00
Examination Morning Session – Essay (2003) with CFA Level 3
1 × $6.00 -
×
 Confessions of a Pit Trader 2003 with Rick Burgess
1 × $6.00
Confessions of a Pit Trader 2003 with Rick Burgess
1 × $6.00 -
×
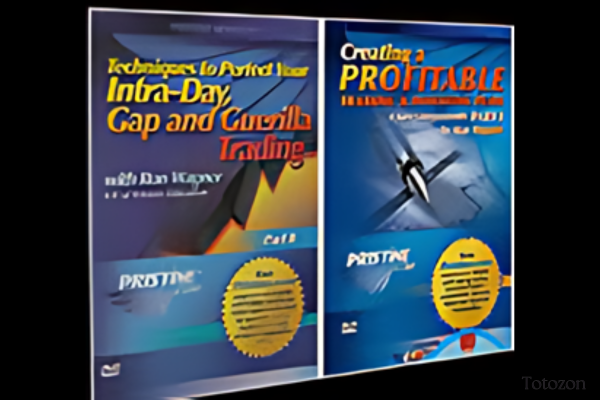 Ron Wagner - Creating a Profitable Trading & Investing Plan + Techniques to Perfect Your Intraday GAP
1 × $6.00
Ron Wagner - Creating a Profitable Trading & Investing Plan + Techniques to Perfect Your Intraday GAP
1 × $6.00 -
×
 AstroFX Course
1 × $6.00
AstroFX Course
1 × $6.00 -
×
 Investing Smart. How to Pick Stocks with Investors Business Daily By Dhun H.Sethna
1 × $4.00
Investing Smart. How to Pick Stocks with Investors Business Daily By Dhun H.Sethna
1 × $4.00 -
×
 The New Science of Asset Allocation with Thomas Schneeweis
1 × $6.00
The New Science of Asset Allocation with Thomas Schneeweis
1 × $6.00 -
×
 You AreThe Indicator Online Course
1 × $31.00
You AreThe Indicator Online Course
1 × $31.00 -
×
 Hedge Funds for Dummies
1 × $6.00
Hedge Funds for Dummies
1 × $6.00 -
×
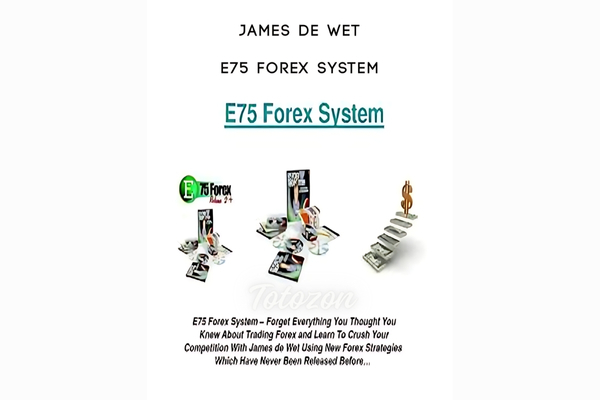 E75 Forex System with James de Wet
1 × $6.00
E75 Forex System with James de Wet
1 × $6.00 -
×
 Complete Portfolio and Stock Comparison Spreadsheet with Joseph Hogue
1 × $6.00
Complete Portfolio and Stock Comparison Spreadsheet with Joseph Hogue
1 × $6.00 -
×
 Beginners Guide To Technical Analysis with Henry Gambell
1 × $15.00
Beginners Guide To Technical Analysis with Henry Gambell
1 × $15.00 -
×
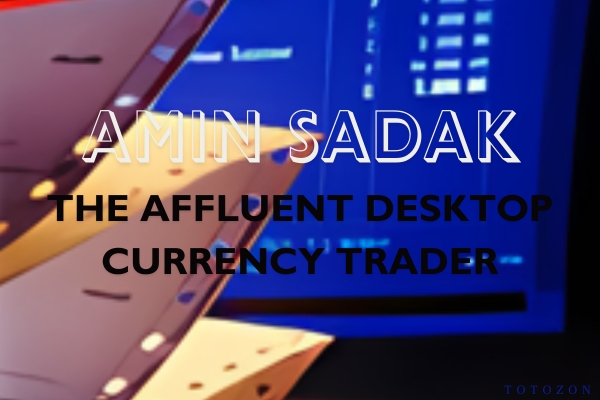 The Afluent Desktop Currency Trader with Amin Sadak
1 × $6.00
The Afluent Desktop Currency Trader with Amin Sadak
1 × $6.00 -
×
 3 Steps To Supply/Demand + 3 Steps To Market Profile 10% Off Combined Price
1 × $23.00
3 Steps To Supply/Demand + 3 Steps To Market Profile 10% Off Combined Price
1 × $23.00 -
×
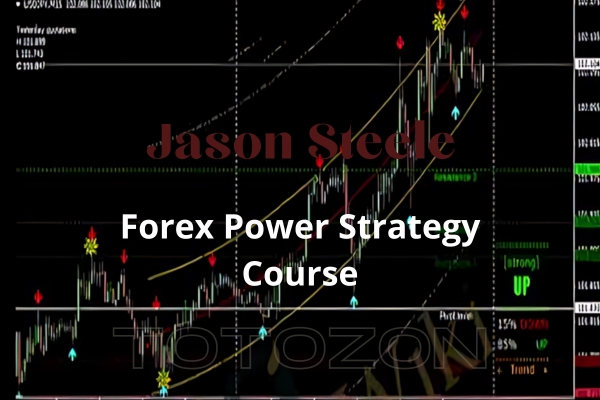 Forex Power Strategy Course with Jason Steele
1 × $6.00
Forex Power Strategy Course with Jason Steele
1 × $6.00 -
×
 Future DayTrading (German)
1 × $6.00
Future DayTrading (German)
1 × $6.00 -
×
 OPTIONS FOR BEGINNERS
1 × $6.00
OPTIONS FOR BEGINNERS
1 × $6.00 -
×
 A Non-Random Walk Down Wall Street with Andrew W.Lo
1 × $6.00
A Non-Random Walk Down Wall Street with Andrew W.Lo
1 × $6.00 -
×
 ICT Prodigy Trading Course – $650K in Payouts with Alex Solignani
1 × $15.00
ICT Prodigy Trading Course – $650K in Payouts with Alex Solignani
1 × $15.00 -
×
 Master Time Factor & Forecasting with Mathematical Rules
1 × $6.00
Master Time Factor & Forecasting with Mathematical Rules
1 × $6.00 -
×
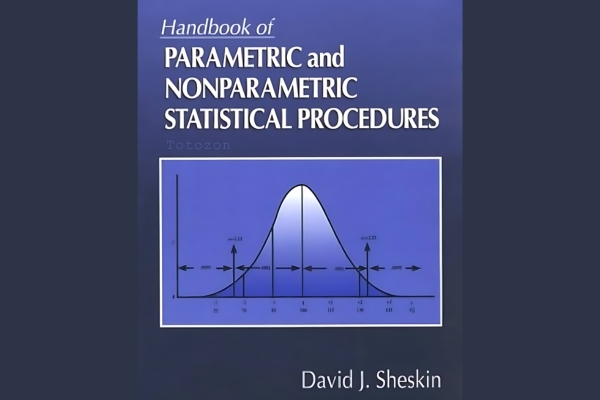 HandBook of Parametric and Nonparametric Statistical Procedures with David J.Sheskin
1 × $6.00
HandBook of Parametric and Nonparametric Statistical Procedures with David J.Sheskin
1 × $6.00 -
×
 Pristine - Oliver Velez – Swing Trading Tactics 2001
1 × $6.00
Pristine - Oliver Velez – Swing Trading Tactics 2001
1 × $6.00 -
×
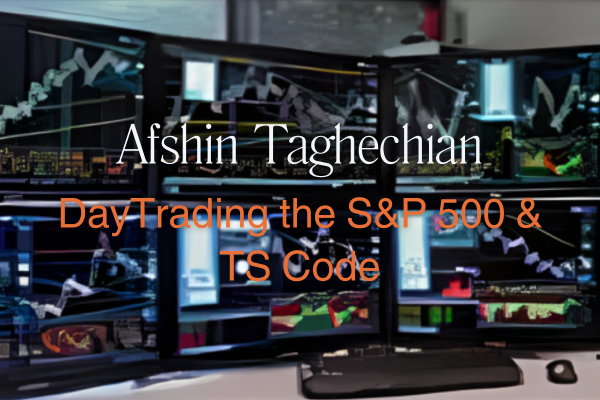 DayTrading the S&P 500 & TS Code with Afshin Taghechian
1 × $6.00
DayTrading the S&P 500 & TS Code with Afshin Taghechian
1 × $6.00 -
×
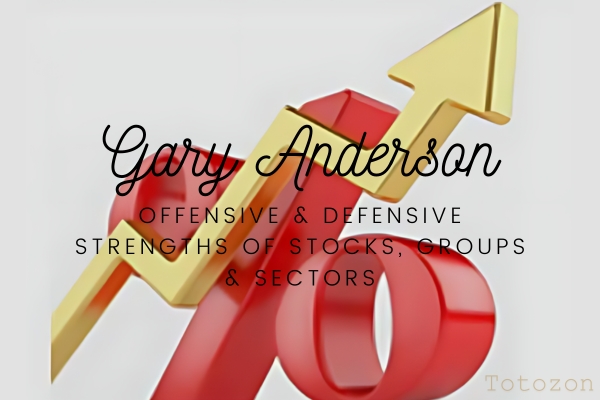 Offensive & Defensive Strengths of Stocks, Groups & Sectors Gary Anderson
1 × $6.00
Offensive & Defensive Strengths of Stocks, Groups & Sectors Gary Anderson
1 × $6.00 -
×
 War Room Technicals Volume 2 with Pat Mitchell – Trick Trades
1 × $6.00
War Room Technicals Volume 2 with Pat Mitchell – Trick Trades
1 × $6.00 -
×
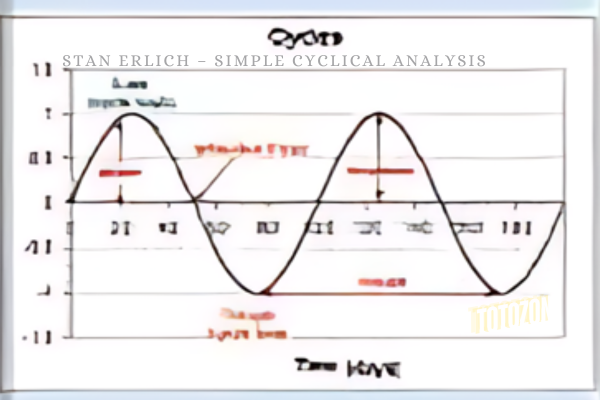 Simple Cyclical Analysis with Stan Erlich
1 × $6.00
Simple Cyclical Analysis with Stan Erlich
1 × $6.00 -
×
 Rocket Science for Traders with John Ehlers
1 × $6.00
Rocket Science for Traders with John Ehlers
1 × $6.00 -
×
![ACD Method [Video (6 MP4s)] with Mark Fisher](https://www.totozon.com/wp-content/uploads/2024/05/ACD-Method-Video-6-MP4s-with-Mark-Fisher.jpg) ACD Method [Video (6 MP4s)] with Mark Fisher
1 × $6.00
ACD Method [Video (6 MP4s)] with Mark Fisher
1 × $6.00 -
×
 The Random Character of Interest Rates with Joseph Murphy
1 × $6.00
The Random Character of Interest Rates with Joseph Murphy
1 × $6.00 -
×
 A+ Setups Big Caps Options with Jtrader
1 × $6.00
A+ Setups Big Caps Options with Jtrader
1 × $6.00 -
×
 Basic Options Course Cash Flow. Diversification. Flexibility with Michael Drew
1 × $6.00
Basic Options Course Cash Flow. Diversification. Flexibility with Michael Drew
1 × $6.00 -
×
 Harmonic Elliott Wave: The Case for Modification of R. N. Elliott's Impulsive Wave Structure with Ian Copsey
1 × $6.00
Harmonic Elliott Wave: The Case for Modification of R. N. Elliott's Impulsive Wave Structure with Ian Copsey
1 × $6.00 -
×
 Elite Trader Package
1 × $31.00
Elite Trader Package
1 × $31.00 -
×
 Mastering Amibroker Formula Language
1 × $15.00
Mastering Amibroker Formula Language
1 × $15.00 -
×
 The Dark Side Of Valuation with Aswath Damodaran
1 × $6.00
The Dark Side Of Valuation with Aswath Damodaran
1 × $6.00 -
×
 New Market Mavericks with Geoff Cutmore
1 × $6.00
New Market Mavericks with Geoff Cutmore
1 × $6.00 -
×
 A Grand Supercycle Top Webinar with Steven Hochberg
1 × $6.00
A Grand Supercycle Top Webinar with Steven Hochberg
1 × $6.00 -
×
 Advances in International Investments: Traditional and Alternative Approaches with Hung-Gay Fung, Xiaoqing Eleanor Xu & Jot Yau
1 × $6.00
Advances in International Investments: Traditional and Alternative Approaches with Hung-Gay Fung, Xiaoqing Eleanor Xu & Jot Yau
1 × $6.00 -
×
 Come Into My Trading Room: A Complete Guide to Trading with Alexander Elder
1 × $6.00
Come Into My Trading Room: A Complete Guide to Trading with Alexander Elder
1 × $6.00 -
×
 Pristine - Cardinal Rules of Trading
1 × $6.00
Pristine - Cardinal Rules of Trading
1 × $6.00 -
×
 0 DTE Options Trading Workshop with Aeromir Corporation
1 × $15.00
0 DTE Options Trading Workshop with Aeromir Corporation
1 × $15.00 -
×
 Affinity Foundation Option Course with Affinitytrading
1 × $6.00
Affinity Foundation Option Course with Affinitytrading
1 × $6.00 -
×
 Futures Day Trading And Order Flow Course with Trade Pro Academy
1 × $15.00
Futures Day Trading And Order Flow Course with Trade Pro Academy
1 × $15.00 -
×
 Matrix Options
1 × $6.00
Matrix Options
1 × $6.00 -
×
 The Geography of Money with Benjamin J.Cohen
1 × $6.00
The Geography of Money with Benjamin J.Cohen
1 × $6.00 -
×
 Cash In On Chaos with Hans Hannula
1 × $6.00
Cash In On Chaos with Hans Hannula
1 × $6.00 -
×
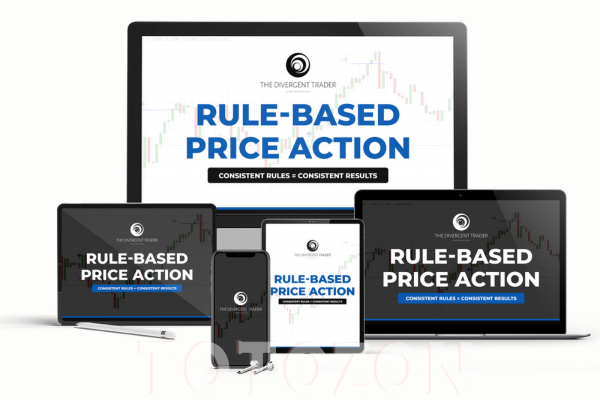 Rule Based Price Action with Trader Divergent
1 × $5.00
Rule Based Price Action with Trader Divergent
1 × $5.00 -
×
 Confidence to Hypnotize
1 × $6.00
Confidence to Hypnotize
1 × $6.00 -
×
 Butterfly and Condor Workshop with Aeromir
1 × $15.00
Butterfly and Condor Workshop with Aeromir
1 × $15.00 -
×
 A Mathematician Plays The Stock Market with John Allen Paulos
1 × $6.00
A Mathematician Plays The Stock Market with John Allen Paulos
1 × $6.00 -
×
 Trading Hub 4.0 with Mr. Khan
1 × $27.00
Trading Hub 4.0 with Mr. Khan
1 × $27.00 -
×
 Crystal Ball Pack PLUS bonus Live Trade By Pat Mitchell - Trick Trades
1 × $20.00
Crystal Ball Pack PLUS bonus Live Trade By Pat Mitchell - Trick Trades
1 × $20.00 -
×
 Trading with Wave59 with Earik Beann
1 × $6.00
Trading with Wave59 with Earik Beann
1 × $6.00 -
×
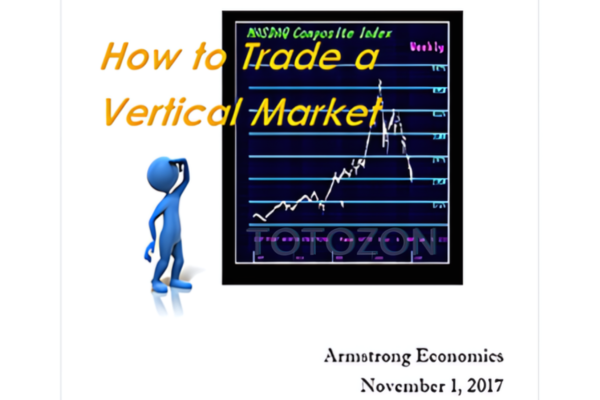 How to Trade a Vertical Market with Armstrong Economics
1 × $155.00
How to Trade a Vertical Market with Armstrong Economics
1 × $155.00 -
×
 Trading Calendar Spreads with Option Pit
1 × $39.00
Trading Calendar Spreads with Option Pit
1 × $39.00 -
×
 An Introduction to Option Trading Success with James Bittman
1 × $6.00
An Introduction to Option Trading Success with James Bittman
1 × $6.00 -
×
 The Noise Trader Approach to Finance (Article) with Andrei Schleifer, Laurence H.Summers
1 × $6.00
The Noise Trader Approach to Finance (Article) with Andrei Schleifer, Laurence H.Summers
1 × $6.00 -
×
 Principles of Artificial Neural Networks (2nd Ed.) with Daniel Graupe
1 × $6.00
Principles of Artificial Neural Networks (2nd Ed.) with Daniel Graupe
1 × $6.00 -
×
 How to Value & Sell your Business with Andrew Heslop
1 × $6.00
How to Value & Sell your Business with Andrew Heslop
1 × $6.00 -
×
 Directional Calendars in 2023 with Dan Sheridan & Mark Fenton - Sheridan Options Mentoring
1 × $85.00
Directional Calendars in 2023 with Dan Sheridan & Mark Fenton - Sheridan Options Mentoring
1 × $85.00 -
×
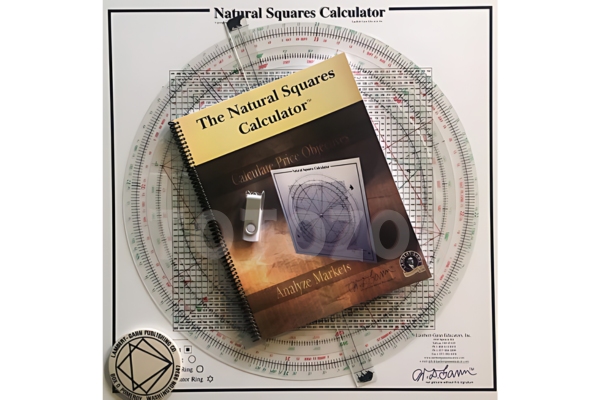 Natural Squares Calculator with Lambert-Gann Educators
1 × $6.00
Natural Squares Calculator with Lambert-Gann Educators
1 × $6.00 -
×
 8 Strategies for Day Trading
1 × $31.00
8 Strategies for Day Trading
1 × $31.00 -
×
 Predicting Market Trends with Periodic Number Cycle
1 × $6.00
Predicting Market Trends with Periodic Number Cycle
1 × $6.00 -
×
 Asset Prices, Booms & Recessions (2nd Ed.) with Willi Semmler
1 × $6.00
Asset Prices, Booms & Recessions (2nd Ed.) with Willi Semmler
1 × $6.00 -
×
 The Indices Orderflow Masterclass with The Forex Scalpers
1 × $23.00
The Indices Orderflow Masterclass with The Forex Scalpers
1 × $23.00 -
×
 How to Find the Most Profitable Stocks with Mubarak Shah
1 × $6.00
How to Find the Most Profitable Stocks with Mubarak Shah
1 × $6.00 -
×
 The 5 Day Momentum Method
1 × $6.00
The 5 Day Momentum Method
1 × $6.00 -
×
 Forex Trading with Ed Ponsi
1 × $6.00
Forex Trading with Ed Ponsi
1 × $6.00 -
×
 Offshore Keys (2023)
1 × $5.00
Offshore Keys (2023)
1 × $5.00 -
×
 High Probability Trading Using Elliott Wave And Fibonacci Analysis withVic Patel - Forex Training Group
1 × $10.00
High Probability Trading Using Elliott Wave And Fibonacci Analysis withVic Patel - Forex Training Group
1 × $10.00

Reading & Understanding Charts with Andrew Baxter
$6.00
File Size: 311MB
Delivery Time: 1–12 hours
Media Type: Online Course
Content Proof: Watch Here!
You may check content proof of “Reading & Understanding Chartsb with Andrew Baxter” below:

Reading & Understanding Charts with Andrew Baxter
Introduction to Chart Reading
Charts are essential tools for traders, providing visual representations of market data. Andrew Baxter, a renowned trader and educator, shares his expertise on how to read and understand charts effectively. This article will guide you through the basics and advanced techniques of chart reading, helping you make informed trading decisions.
What are Trading Charts?
Definition and Purpose
Trading charts are graphical representations of price movements over time. They help traders analyze trends, identify patterns, and make predictions about future price movements.
Importance of Chart Reading
Understanding charts is crucial for making data-driven decisions in trading. It reduces emotional trading and enhances your ability to spot opportunities and risks.
Types of Trading Charts
1. Line Charts
Line charts are the simplest form of trading charts, showing the closing prices over a period. They provide a clear view of the overall trend but lack detailed information.
2. Bar Charts
Bar charts display the opening, closing, high, and low prices for each period. They offer more information than line charts and help in understanding price volatility.
3. Candlestick Charts
Candlestick charts are popular due to their detailed and visually appealing format. Each candlestick shows the opening, closing, high, and low prices, making it easier to identify market sentiment.
Understanding Candlestick Charts
Components of a Candlestick
- Body: The filled part showing the opening and closing prices.
- Wicks/Shadows: The thin lines representing the high and low prices.
- Color: Indicates whether the closing price was higher (typically green) or lower (typically red) than the opening price.
Common Candlestick Patterns
1. Doji
A Doji occurs when the opening and closing prices are nearly the same, indicating indecision in the market.
2. Hammer
A Hammer has a small body with a long lower wick, suggesting a potential reversal from a downtrend.
3. Engulfing Pattern
An Engulfing pattern occurs when a larger candlestick completely engulfs the previous smaller candlestick, signaling a potential reversal.
Key Chart Patterns
1. Head and Shoulders
This pattern indicates a reversal and is formed by a peak (head) flanked by two smaller peaks (shoulders).
2. Double Top and Double Bottom
These patterns signal a potential reversal. A double top indicates a bearish reversal, while a double bottom suggests a bullish reversal.
3. Triangles
Triangles are continuation patterns that show a period of consolidation before the price continues in the direction of the previous trend.
Using Technical Indicators
1. Moving Averages
Moving averages smooth out price data to identify trends. Common types include Simple Moving Average (SMA) and Exponential Moving Average (EMA).
2. Relative Strength Index (RSI)
RSI measures the speed and change of price movements, indicating overbought or oversold conditions.
3. Moving Average Convergence Divergence (MACD)
MACD shows the relationship between two moving averages, helping to identify potential buy and sell signals.
Combining Chart Patterns and Indicators
Integrated Analysis
Combining chart patterns with technical indicators enhances the reliability of trading signals. For example, confirming a head and shoulders pattern with RSI divergence can provide a stronger signal.
Practical Application
Use a combination of patterns and indicators to develop a comprehensive trading strategy. This approach helps in making more informed and confident trading decisions.
Advanced Chart Reading Techniques
1. Fibonacci Retracement
Fibonacci retracement levels indicate potential support and resistance levels based on the Fibonacci sequence.
2. Volume Analysis
Volume analysis involves examining the number of shares traded to confirm the strength of a price movement or trend.
3. Divergence
Divergence occurs when the price moves in the opposite direction of an indicator, signaling a potential reversal.
Common Mistakes in Chart Reading
1. Overcomplicating Analysis
Avoid using too many indicators and patterns at once. Focus on a few reliable tools to keep your analysis clear and effective.
2. Ignoring Context
Always consider the broader market context and economic factors. Relying solely on charts without context can lead to misleading conclusions.
3. Emotional Trading
Stick to your analysis and avoid making decisions based on emotions. Emotional trading can undermine even the best chart reading skills.
Benefits of Mastering Chart Reading
1. Improved Decision Making
Accurate chart reading helps you make informed decisions, reducing the risk of losses and increasing the potential for gains.
2. Enhanced Trading Strategy
Understanding charts allows you to develop and refine your trading strategies, making them more effective and adaptable.
3. Increased Confidence
With better chart reading skills, you gain confidence in your trading decisions, leading to more consistent performance.
Conclusion
Reading and understanding charts with insights from Andrew Baxter can significantly improve your trading performance. By mastering various chart types, patterns, and technical indicators, you can make more informed decisions and develop robust trading strategies. Embrace these principles, continuously practice, and refine your skills to become a proficient trader.
Frequently Asked Questions:
What are the main types of trading charts?
The main types are line charts, bar charts, and candlestick charts.
Why are candlestick charts popular?
Candlestick charts are popular due to their detailed and visually appealing format, making it easier to identify market sentiment.
What are some common candlestick patterns?
Common patterns include Doji, Hammer, and Engulfing patterns.
How can technical indicators enhance chart reading?
Technical indicators like moving averages, RSI, and MACD help identify trends, momentum, and potential buy/sell signals.
What are some advanced chart reading techniques?
Advanced techniques include Fibonacci retracement, volume analysis, and divergence.
Be the first to review “Reading & Understanding Charts with Andrew Baxter”
You must be logged in to post a review.
Related products

Original price was: $497.00.$31.00Current price is: $31.00.

Forex Trading
Original price was: $397.00.$31.00Current price is: $31.00.

Original price was: $1,800.00.$54.00Current price is: $54.00.
Original price was: $450.00.$23.00Current price is: $23.00.

Original price was: $299.00.$8.00Current price is: $8.00.

Forex Trading
Quantamentals – The Next Great Forefront Of Trading and Investing with Trading Markets
Original price was: $1,495.00.$8.00Current price is: $8.00.

Original price was: $197.00.$5.00Current price is: $5.00.

Forex Trading
Original price was: $239.00.$8.00Current price is: $8.00.

Forex Trading
Original price was: $697.00.$5.00Current price is: $5.00.

Original price was: $799.00.$15.00Current price is: $15.00.

Forex Trading
Original price was: $249.00.$15.00Current price is: $15.00.
Original price was: $1,200.00.$23.00Current price is: $23.00.

Original price was: $997.00.$13.00Current price is: $13.00.
Original price was: $649.00.$20.00Current price is: $20.00.

Original price was: $310.00.$23.00Current price is: $23.00.

Original price was: $695.00.$41.00Current price is: $41.00.

Original price was: $999.00.$5.00Current price is: $5.00.
Forex Trading
Original price was: $1,898.00.$10.00Current price is: $10.00.
Original price was: $2,120.00.$15.00Current price is: $15.00.

Original price was: $4,995.00.$15.00Current price is: $15.00.

Reviews
There are no reviews yet.