-
×
 The Realistic Trader - Crypto Currencies
1 × $31.00
The Realistic Trader - Crypto Currencies
1 × $31.00 -
×
 AI For Traders with Trading Markets
1 × $31.00
AI For Traders with Trading Markets
1 × $31.00 -
×
 Real Options Analysis: Tools and Techniques for Valuing Strategic Investments and Decisions - Johnathan Mun
1 × $6.00
Real Options Analysis: Tools and Techniques for Valuing Strategic Investments and Decisions - Johnathan Mun
1 × $6.00 -
×
 Chart Analysis Boot Camp Course Webinar with Mike Albright
1 × $6.00
Chart Analysis Boot Camp Course Webinar with Mike Albright
1 × $6.00 -
×
 Toast FX Course
1 × $5.00
Toast FX Course
1 × $5.00 -
×
 Fibonnacci Trader WorkShop (Video 2.38 GB) with Dennis Bolze, Thom Hartle
1 × $6.00
Fibonnacci Trader WorkShop (Video 2.38 GB) with Dennis Bolze, Thom Hartle
1 × $6.00 -
×
 Exploring MetaStock Advanced with Martin Pring
1 × $6.00
Exploring MetaStock Advanced with Martin Pring
1 × $6.00 -
×
 The Top Tier Pro System Basic with Raghee Horner
1 × $41.00
The Top Tier Pro System Basic with Raghee Horner
1 × $41.00 -
×
 TradingWithBilz Course
1 × $10.00
TradingWithBilz Course
1 × $10.00 -
×
 Andy’s EMini Bar – 60 Min System
1 × $6.00
Andy’s EMini Bar – 60 Min System
1 × $6.00 -
×
 The Best Option Trading Course with David Jaffee - Best Stock Strategy
1 × $15.00
The Best Option Trading Course with David Jaffee - Best Stock Strategy
1 × $15.00 -
×
 Market Evolution
1 × $6.00
Market Evolution
1 × $6.00 -
×
 Inner Cicle Trader - ICT Methods with Michael Huddleston
1 × $5.00
Inner Cicle Trader - ICT Methods with Michael Huddleston
1 × $5.00 -
×
 Advanced Spread Trading with Guy Bower - MasterClass Trader
1 × $15.00
Advanced Spread Trading with Guy Bower - MasterClass Trader
1 × $15.00 -
×
 The MMXM Traders Course - The MMXM Trader
1 × $5.00
The MMXM Traders Course - The MMXM Trader
1 × $5.00 -
×
 Catching the Bounce
1 × $6.00
Catching the Bounce
1 × $6.00 -
×
 Scalping Strategy Webinar! recorded. BEST WEBINAR
1 × $23.00
Scalping Strategy Webinar! recorded. BEST WEBINAR
1 × $23.00 -
×
 FestX Main Online video Course with Clint Fester
1 × $5.00
FestX Main Online video Course with Clint Fester
1 × $5.00 -
×
 Introduction to Futures & Options Markets (2nd Ed.)
1 × $6.00
Introduction to Futures & Options Markets (2nd Ed.)
1 × $6.00 -
×
 Natural Squares Calculator with Lambert-Gann Educators
1 × $6.00
Natural Squares Calculator with Lambert-Gann Educators
1 × $6.00 -
×
 Reading The Tape Trade Series with CompassFX
1 × $10.00
Reading The Tape Trade Series with CompassFX
1 × $10.00 -
×
 Weekly Options Windfall and Bonus with James Preston
1 × $54.00
Weekly Options Windfall and Bonus with James Preston
1 × $54.00 -
×
 The Box Strategy with Blue Capital Academy
1 × $23.00
The Box Strategy with Blue Capital Academy
1 × $23.00 -
×
 Trade Your Way to Wealth with Bill Kraft
1 × $6.00
Trade Your Way to Wealth with Bill Kraft
1 × $6.00 -
×
 Options, Futures & Other Derivatives (6th Ed.)
1 × $6.00
Options, Futures & Other Derivatives (6th Ed.)
1 × $6.00 -
×
 CNBC 24-7 Trading with Barbara Rockefeller
1 × $6.00
CNBC 24-7 Trading with Barbara Rockefeller
1 × $6.00 -
×
 Jack Corsellis Bundle 2021 Full Course with Jack Corsellis
1 × $5.00
Jack Corsellis Bundle 2021 Full Course with Jack Corsellis
1 × $5.00 -
×
 Investment Science with David G.Luenberger
1 × $6.00
Investment Science with David G.Luenberger
1 × $6.00 -
×
 Scalping the Nasdaq Emini Futures Method (Includes Indicators) with Ryan Watts
1 × $4.00
Scalping the Nasdaq Emini Futures Method (Includes Indicators) with Ryan Watts
1 × $4.00 -
×
 Practical Approach to Ninjatrader 8 Platform with Rajandran R
1 × $6.00
Practical Approach to Ninjatrader 8 Platform with Rajandran R
1 × $6.00 -
×
 CFA Pro Level 1 2004 CD - Scheweser
1 × $6.00
CFA Pro Level 1 2004 CD - Scheweser
1 × $6.00 -
×
 Winning System For Trading High-Performance Stocks with Tim Cho
1 × $6.00
Winning System For Trading High-Performance Stocks with Tim Cho
1 × $6.00 -
×
 Quantifiable Edges VIX Trading Course with Amibroker Code - Quantifiable Edges
1 × $15.00
Quantifiable Edges VIX Trading Course with Amibroker Code - Quantifiable Edges
1 × $15.00 -
×
 Financial Astrology Course with Brian James Sklenka
1 × $6.00
Financial Astrology Course with Brian James Sklenka
1 × $6.00 -
×
 Volatility and Timing with Jay Kaeppel – The Option Trader’s Guide to Probability
1 × $6.00
Volatility and Timing with Jay Kaeppel – The Option Trader’s Guide to Probability
1 × $6.00 -
×
 WondaFX Signature Strategy with WondaFX
1 × $5.00
WondaFX Signature Strategy with WondaFX
1 × $5.00 -
×
 Portfolio Management in Practice with Christine Brentani
1 × $6.00
Portfolio Management in Practice with Christine Brentani
1 × $6.00 -
×
 Investors Live Textbook Trading DVD
1 × $15.00
Investors Live Textbook Trading DVD
1 × $15.00 -
×
 The 2021 TraderLion Stock Trading Conference with Trader Lion
1 × $5.00
The 2021 TraderLion Stock Trading Conference with Trader Lion
1 × $5.00 -
×
 Trading The Hobbs Triple Crown Strategy with Derrik Hobbs
1 × $6.00
Trading The Hobbs Triple Crown Strategy with Derrik Hobbs
1 × $6.00 -
×
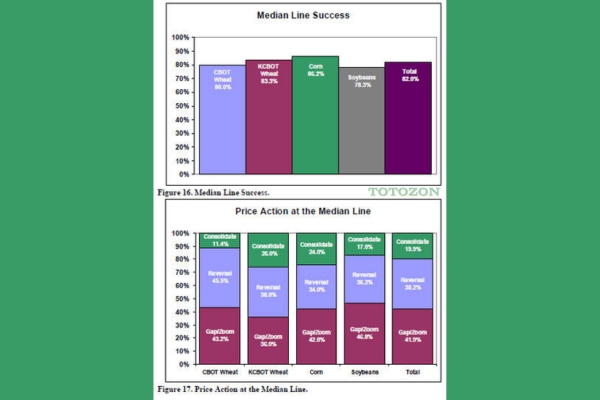 Using Median Lines as a Trading Tool with Greg Fisher
1 × $6.00
Using Median Lines as a Trading Tool with Greg Fisher
1 × $6.00 -
×
 Profiting With Forex: The Most Effective Tools and Techniques for Trading Currencies - John Jagerson & Wade Hansen
1 × $6.00
Profiting With Forex: The Most Effective Tools and Techniques for Trading Currencies - John Jagerson & Wade Hansen
1 × $6.00 -
×
 Essentials in Quantitative Trading QT01 By HangukQuant's
1 × $23.00
Essentials in Quantitative Trading QT01 By HangukQuant's
1 × $23.00 -
×
 IRON CONDORS FOR INCOME 2017 with Sheridan Options Mentoring
1 × $6.00
IRON CONDORS FOR INCOME 2017 with Sheridan Options Mentoring
1 × $6.00 -
×
 Forex Trading For Beginners with John Jagerson - Investopedia Academy
1 × $6.00
Forex Trading For Beginners with John Jagerson - Investopedia Academy
1 × $6.00 -
×
 Options Trading & Ultimate MasterClass With Tyrone Abela - FX Evolution
1 × $54.00
Options Trading & Ultimate MasterClass With Tyrone Abela - FX Evolution
1 × $54.00 -
×
 Mastering Trading Stress with Ari Kiev
1 × $6.00
Mastering Trading Stress with Ari Kiev
1 × $6.00 -
×
 Crypto Trading Academy with Cheeky Investor - Aussie Day Trader
1 × $13.00
Crypto Trading Academy with Cheeky Investor - Aussie Day Trader
1 × $13.00 -
×
 Sacredscience - R.N.Elliott – Nature’s Law. The secret of the Universe
1 × $6.00
Sacredscience - R.N.Elliott – Nature’s Law. The secret of the Universe
1 × $6.00 -
×
 Risk Management Toolkit with Peter Bain
1 × $6.00
Risk Management Toolkit with Peter Bain
1 × $6.00 -
×
 Momentum Signals Training Course with Fulcum Trader
1 × $5.00
Momentum Signals Training Course with Fulcum Trader
1 × $5.00 -
×
 The Orderflows Trade Opportunities Encyclopedia with Michael Valtos
1 × $8.00
The Orderflows Trade Opportunities Encyclopedia with Michael Valtos
1 × $8.00 -
×
 George Bayer Soft 1.02
1 × $6.00
George Bayer Soft 1.02
1 × $6.00 -
×
 Selling Options For A Living Class with Don Kaufman
1 × $6.00
Selling Options For A Living Class with Don Kaufman
1 × $6.00 -
×
 Targeting Profitable Entry & Exit Points with Alan Farley
1 × $6.00
Targeting Profitable Entry & Exit Points with Alan Farley
1 × $6.00 -
×
 DAY TRADING COURSE 2018
1 × $6.00
DAY TRADING COURSE 2018
1 × $6.00 -
×
 FXjake Daily Trader Program
1 × $31.00
FXjake Daily Trader Program
1 × $31.00 -
×
 Complete Portfolio and Stock Comparison Spreadsheet with Joseph Hogue
1 × $6.00
Complete Portfolio and Stock Comparison Spreadsheet with Joseph Hogue
1 × $6.00 -
×
 Activedaytrader - Workshop: Unusual Options
1 × $6.00
Activedaytrader - Workshop: Unusual Options
1 × $6.00 -
×
 The Holy Grail Forex Strategy - 7 Setups To Conquer The Kingdom with Justin Whitebread-Lanaro - 1 Minute Master
1 × $15.00
The Holy Grail Forex Strategy - 7 Setups To Conquer The Kingdom with Justin Whitebread-Lanaro - 1 Minute Master
1 × $15.00 -
×
 Sacredscience - Sepharial – Your Personal Diurnal Chart
1 × $6.00
Sacredscience - Sepharial – Your Personal Diurnal Chart
1 × $6.00 -
×
 The Michanics of Futures Trading - Roy Habben
1 × $6.00
The Michanics of Futures Trading - Roy Habben
1 × $6.00 -
×
 Super Conference 2020 - Premier Coaching Package with Vince Vora
1 × $109.00
Super Conference 2020 - Premier Coaching Package with Vince Vora
1 × $109.00 -
×
 Vertex Investing Course (2023)
1 × $8.00
Vertex Investing Course (2023)
1 × $8.00 -
×
 Amazing Day Trading Ninjatrader Indicator Perfect For Stocks, Futures And Forex
1 × $15.00
Amazing Day Trading Ninjatrader Indicator Perfect For Stocks, Futures And Forex
1 × $15.00 -
×
 7 Days Options Masters Course with John Carter
1 × $54.00
7 Days Options Masters Course with John Carter
1 × $54.00 -
×
 Daily Price Action
1 × $23.00
Daily Price Action
1 × $23.00 -
×
 DNA Wealth Blueprint 3 (Complete)
1 × $54.00
DNA Wealth Blueprint 3 (Complete)
1 × $54.00 -
×
 Support and Resistance Trading with Rob Booker
1 × $6.00
Support and Resistance Trading with Rob Booker
1 × $6.00 -
×
 The Cash Flow Bootcamp with John Macgregor
1 × $233.00
The Cash Flow Bootcamp with John Macgregor
1 × $233.00 -
×
 Trading Strategies for Capital Markets with Joseph Benning
1 × $6.00
Trading Strategies for Capital Markets with Joseph Benning
1 × $6.00 -
×
 Winning – Zodiacal Timing Revised 1980 with Joyce Wehrman
1 × $6.00
Winning – Zodiacal Timing Revised 1980 with Joyce Wehrman
1 × $6.00 -
×
 Defending Options with Simpler Options
1 × $6.00
Defending Options with Simpler Options
1 × $6.00 -
×
 Symmetry Wave Theory with Michael Gur
1 × $6.00
Symmetry Wave Theory with Michael Gur
1 × $6.00 -
×
 TRADINGWITHRAYNER - PRICE ACTION TRADING INSTITUTE
1 × $23.00
TRADINGWITHRAYNER - PRICE ACTION TRADING INSTITUTE
1 × $23.00 -
×
 TRADING NFX Course with Andrew NFX
1 × $5.00
TRADING NFX Course with Andrew NFX
1 × $5.00 -
×
 Trading Short TermSame Day Trades Sep 2023 with Dan Sheridan & Mark Fenton - Sheridan Options Mentoring
1 × $31.00
Trading Short TermSame Day Trades Sep 2023 with Dan Sheridan & Mark Fenton - Sheridan Options Mentoring
1 × $31.00 -
×
 Stock Trading Using Planetary Time Cycles – The Gann Method Volume I,II + Gann Astro Vol III Horoscopes and Trading Methods By Michael S. Jenkins – Stock Cycles Forecast
1 × $6.00
Stock Trading Using Planetary Time Cycles – The Gann Method Volume I,II + Gann Astro Vol III Horoscopes and Trading Methods By Michael S. Jenkins – Stock Cycles Forecast
1 × $6.00 -
×
 W. D Gann 's Square Of 9 Applied To Modern Markets with Sean Avidar - Hexatrade350
1 × $23.00
W. D Gann 's Square Of 9 Applied To Modern Markets with Sean Avidar - Hexatrade350
1 × $23.00 -
×
 The Aggressive Investor. Case Studies with Colin Nicholson
1 × $6.00
The Aggressive Investor. Case Studies with Colin Nicholson
1 × $6.00 -
×
 Stock Trading Success - You Make The Call - How To Set Entries And Exits with Steve Nison and K.Cal
1 × $6.00
Stock Trading Success - You Make The Call - How To Set Entries And Exits with Steve Nison and K.Cal
1 × $6.00 -
×
 How to Pick Hot Reverse Merger Penny Stocks with John Lux
1 × $5.00
How to Pick Hot Reverse Merger Penny Stocks with John Lux
1 × $5.00 -
×
 Market Making Scalping Manual with Gary Norden - Jigsaw Trading
1 × $69.00
Market Making Scalping Manual with Gary Norden - Jigsaw Trading
1 × $69.00 -
×
 Chaos. The New Map for Traders
1 × $15.00
Chaos. The New Map for Traders
1 × $15.00 -
×
 George Wollsten: Expert Stock and Grain Trader with George Bayer
1 × $6.00
George Wollsten: Expert Stock and Grain Trader with George Bayer
1 × $6.00 -
×
 Wyckoff simplified from Michael Z
1 × $6.00
Wyckoff simplified from Michael Z
1 × $6.00 -
×
 RSI Unleashed: Building a Comprehensive Trading Framework By Doc Severson
1 × $6.00
RSI Unleashed: Building a Comprehensive Trading Framework By Doc Severson
1 × $6.00 -
×
 Exchange-Traded Derivatives with Erik Banks
1 × $6.00
Exchange-Traded Derivatives with Erik Banks
1 × $6.00 -
×
 SO FX Educational Course with SO FX
1 × $5.00
SO FX Educational Course with SO FX
1 × $5.00 -
×
 Affinity Foundation Stocks Course with Affinitytrading
1 × $6.00
Affinity Foundation Stocks Course with Affinitytrading
1 × $6.00 -
×
 Precision Timing Your Options Trades Using Fibonacci with Trading Analysis
1 × $15.00
Precision Timing Your Options Trades Using Fibonacci with Trading Analysis
1 × $15.00 -
×
 The Double Thurst Stock Trading System
1 × $15.00
The Double Thurst Stock Trading System
1 × $15.00 -
×
 The 3 Skills of Top Trading with Hank Pruden
1 × $6.00
The 3 Skills of Top Trading with Hank Pruden
1 × $6.00 -
×
 ePass Platinum
1 × $31.00
ePass Platinum
1 × $31.00 -
×
 Trade Like Warren Buffett with James Altucher
1 × $6.00
Trade Like Warren Buffett with James Altucher
1 × $6.00 -
×
 Quantamentals - The Next Great Forefront Of Trading and Investing with Trading Markets
1 × $8.00
Quantamentals - The Next Great Forefront Of Trading and Investing with Trading Markets
1 × $8.00

Reading & Understanding Charts with Andrew Baxter
$6.00
File Size: 311MB
Delivery Time: 1–12 hours
Media Type: Online Course
Content Proof: Watch Here!
You may check content proof of “Reading & Understanding Chartsb with Andrew Baxter” below:

Reading & Understanding Charts with Andrew Baxter
Introduction to Chart Reading
Charts are essential tools for traders, providing visual representations of market data. Andrew Baxter, a renowned trader and educator, shares his expertise on how to read and understand charts effectively. This article will guide you through the basics and advanced techniques of chart reading, helping you make informed trading decisions.
What are Trading Charts?
Definition and Purpose
Trading charts are graphical representations of price movements over time. They help traders analyze trends, identify patterns, and make predictions about future price movements.
Importance of Chart Reading
Understanding charts is crucial for making data-driven decisions in trading. It reduces emotional trading and enhances your ability to spot opportunities and risks.
Types of Trading Charts
1. Line Charts
Line charts are the simplest form of trading charts, showing the closing prices over a period. They provide a clear view of the overall trend but lack detailed information.
2. Bar Charts
Bar charts display the opening, closing, high, and low prices for each period. They offer more information than line charts and help in understanding price volatility.
3. Candlestick Charts
Candlestick charts are popular due to their detailed and visually appealing format. Each candlestick shows the opening, closing, high, and low prices, making it easier to identify market sentiment.
Understanding Candlestick Charts
Components of a Candlestick
- Body: The filled part showing the opening and closing prices.
- Wicks/Shadows: The thin lines representing the high and low prices.
- Color: Indicates whether the closing price was higher (typically green) or lower (typically red) than the opening price.
Common Candlestick Patterns
1. Doji
A Doji occurs when the opening and closing prices are nearly the same, indicating indecision in the market.
2. Hammer
A Hammer has a small body with a long lower wick, suggesting a potential reversal from a downtrend.
3. Engulfing Pattern
An Engulfing pattern occurs when a larger candlestick completely engulfs the previous smaller candlestick, signaling a potential reversal.
Key Chart Patterns
1. Head and Shoulders
This pattern indicates a reversal and is formed by a peak (head) flanked by two smaller peaks (shoulders).
2. Double Top and Double Bottom
These patterns signal a potential reversal. A double top indicates a bearish reversal, while a double bottom suggests a bullish reversal.
3. Triangles
Triangles are continuation patterns that show a period of consolidation before the price continues in the direction of the previous trend.
Using Technical Indicators
1. Moving Averages
Moving averages smooth out price data to identify trends. Common types include Simple Moving Average (SMA) and Exponential Moving Average (EMA).
2. Relative Strength Index (RSI)
RSI measures the speed and change of price movements, indicating overbought or oversold conditions.
3. Moving Average Convergence Divergence (MACD)
MACD shows the relationship between two moving averages, helping to identify potential buy and sell signals.
Combining Chart Patterns and Indicators
Integrated Analysis
Combining chart patterns with technical indicators enhances the reliability of trading signals. For example, confirming a head and shoulders pattern with RSI divergence can provide a stronger signal.
Practical Application
Use a combination of patterns and indicators to develop a comprehensive trading strategy. This approach helps in making more informed and confident trading decisions.
Advanced Chart Reading Techniques
1. Fibonacci Retracement
Fibonacci retracement levels indicate potential support and resistance levels based on the Fibonacci sequence.
2. Volume Analysis
Volume analysis involves examining the number of shares traded to confirm the strength of a price movement or trend.
3. Divergence
Divergence occurs when the price moves in the opposite direction of an indicator, signaling a potential reversal.
Common Mistakes in Chart Reading
1. Overcomplicating Analysis
Avoid using too many indicators and patterns at once. Focus on a few reliable tools to keep your analysis clear and effective.
2. Ignoring Context
Always consider the broader market context and economic factors. Relying solely on charts without context can lead to misleading conclusions.
3. Emotional Trading
Stick to your analysis and avoid making decisions based on emotions. Emotional trading can undermine even the best chart reading skills.
Benefits of Mastering Chart Reading
1. Improved Decision Making
Accurate chart reading helps you make informed decisions, reducing the risk of losses and increasing the potential for gains.
2. Enhanced Trading Strategy
Understanding charts allows you to develop and refine your trading strategies, making them more effective and adaptable.
3. Increased Confidence
With better chart reading skills, you gain confidence in your trading decisions, leading to more consistent performance.
Conclusion
Reading and understanding charts with insights from Andrew Baxter can significantly improve your trading performance. By mastering various chart types, patterns, and technical indicators, you can make more informed decisions and develop robust trading strategies. Embrace these principles, continuously practice, and refine your skills to become a proficient trader.
Frequently Asked Questions:
What are the main types of trading charts?
The main types are line charts, bar charts, and candlestick charts.
Why are candlestick charts popular?
Candlestick charts are popular due to their detailed and visually appealing format, making it easier to identify market sentiment.
What are some common candlestick patterns?
Common patterns include Doji, Hammer, and Engulfing patterns.
How can technical indicators enhance chart reading?
Technical indicators like moving averages, RSI, and MACD help identify trends, momentum, and potential buy/sell signals.
What are some advanced chart reading techniques?
Advanced techniques include Fibonacci retracement, volume analysis, and divergence.
Be the first to review “Reading & Understanding Charts with Andrew Baxter”
You must be logged in to post a review.
Related products
Forex Trading
Original price was: $550.00.$5.00Current price is: $5.00.
Forex Trading
Original price was: $2,995.00.$31.00Current price is: $31.00.
Forex Trading
Original price was: $1,898.00.$10.00Current price is: $10.00.
Original price was: $895.00.$15.00Current price is: $15.00.
Original price was: $997.00.$13.00Current price is: $13.00.

Original price was: $999.00.$5.00Current price is: $5.00.
Original price was: $1,849.00.$15.00Current price is: $15.00.
Forex Trading
Original price was: $397.00.$31.00Current price is: $31.00.

Forex Trading
Original price was: $999.00.$15.00Current price is: $15.00.

Original price was: $497.00.$31.00Current price is: $31.00.

Forex Trading
Original price was: $697.00.$5.00Current price is: $5.00.

Forex Trading
The Complete Guide to Multiple Time Frame Analysis & Reading Price Action with Aiman Almansoori
Original price was: $1,399.00.$13.00Current price is: $13.00.

Original price was: $799.00.$15.00Current price is: $15.00.

Forex Trading
Original price was: $797.00.$10.00Current price is: $10.00.

Forex Trading
Original price was: $499.00.$15.00Current price is: $15.00.

Forex Trading
Original price was: $2,997.00.$23.00Current price is: $23.00.

Original price was: $2,120.00.$15.00Current price is: $15.00.

Forex Trading
Original price was: $799.00.$15.00Current price is: $15.00.

Original price was: $695.00.$41.00Current price is: $41.00.
Forex Trading
Quantamentals – The Next Great Forefront Of Trading and Investing with Trading Markets
Original price was: $1,495.00.$8.00Current price is: $8.00.

Reviews
There are no reviews yet.