-
×
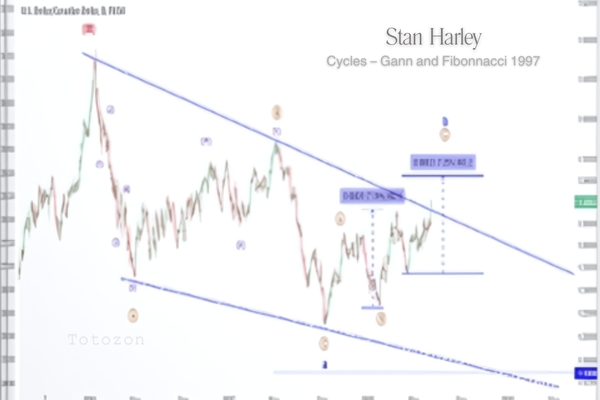 Cycles – Gann and Fibonnacci 1997 with Stan Harley
1 × $6.00
Cycles – Gann and Fibonnacci 1997 with Stan Harley
1 × $6.00 -
×
 TRADING NFX Course with Andrew NFX
1 × $5.00
TRADING NFX Course with Andrew NFX
1 × $5.00 -
×
 Trading Short TermSame Day Trades Sep 2023 with Dan Sheridan & Mark Fenton - Sheridan Options Mentoring
1 × $31.00
Trading Short TermSame Day Trades Sep 2023 with Dan Sheridan & Mark Fenton - Sheridan Options Mentoring
1 × $31.00 -
×
 The Orderflow Masterclass with PrimeTrading
1 × $17.00
The Orderflow Masterclass with PrimeTrading
1 × $17.00 -
×
 The Trading Blueprint with Brad Goh - The Trading Geek
1 × $5.00
The Trading Blueprint with Brad Goh - The Trading Geek
1 × $5.00 -
×
 How To Read The Market Professionally with TradeSmart
1 × $27.00
How To Read The Market Professionally with TradeSmart
1 × $27.00 -
×
 The Complete Guide to Multiple Time Frame Analysis & Reading Price Action with Aiman Almansoori
1 × $13.00
The Complete Guide to Multiple Time Frame Analysis & Reading Price Action with Aiman Almansoori
1 × $13.00 -
×
 Best of the Best: Collars with Amy Meissner & Scott Ruble
1 × $15.00
Best of the Best: Collars with Amy Meissner & Scott Ruble
1 × $15.00 -
×
 The Indices Orderflow Masterclass with The Forex Scalpers
1 × $23.00
The Indices Orderflow Masterclass with The Forex Scalpers
1 × $23.00 -
×
 Turnaround Trader Formula with Ifan Wei - T3 Live
1 × $23.00
Turnaround Trader Formula with Ifan Wei - T3 Live
1 × $23.00 -
×
 BuySide Global Professional (Jul 2018)
1 × $101.00
BuySide Global Professional (Jul 2018)
1 × $101.00 -
×
 Ultimate Gann Trading
1 × $15.00
Ultimate Gann Trading
1 × $15.00 -
×
 The Orderflows Trade Opportunities Encyclopedia with Michael Valtos
1 × $8.00
The Orderflows Trade Opportunities Encyclopedia with Michael Valtos
1 × $8.00 -
×
 The Forex Equinox
1 × $54.00
The Forex Equinox
1 × $54.00 -
×
 Ultimate Scalping Masterclass 4.0 with RockzFX Academy
1 × $6.00
Ultimate Scalping Masterclass 4.0 with RockzFX Academy
1 × $6.00 -
×
 Trade Like an O'Neil Disciple: How We Made 18,000% in the Stock Market with Gil Morales
1 × $6.00
Trade Like an O'Neil Disciple: How We Made 18,000% in the Stock Market with Gil Morales
1 × $6.00 -
×
 The Best Option Trading Course with David Jaffee - Best Stock Strategy
1 × $15.00
The Best Option Trading Course with David Jaffee - Best Stock Strategy
1 × $15.00 -
×
 TradeCraft: Your Path to Peak Performance Trading By Adam Grimes
1 × $15.00
TradeCraft: Your Path to Peak Performance Trading By Adam Grimes
1 × $15.00 -
×
 Mesa & Trading Market Cycles (1st Edition) with John Ehlers & Perry Kaufman
1 × $6.00
Mesa & Trading Market Cycles (1st Edition) with John Ehlers & Perry Kaufman
1 × $6.00 -
×
 The Foreclosures.com Guide to Advanced Investing Techniques with Alexis McGee
1 × $6.00
The Foreclosures.com Guide to Advanced Investing Techniques with Alexis McGee
1 × $6.00 -
×
 Understanding Equity & Trusts with Alastair Hudson
1 × $6.00
Understanding Equity & Trusts with Alastair Hudson
1 × $6.00 -
×
 Zedd Monopoly Platinum
1 × $5.00
Zedd Monopoly Platinum
1 × $5.00 -
×
 Trading Power Tools with Ryan Litchfield
1 × $6.00
Trading Power Tools with Ryan Litchfield
1 × $6.00 -
×
 The Secret to Extraordinary Wealth in the Options Market - 4 DVDs
1 × $31.00
The Secret to Extraordinary Wealth in the Options Market - 4 DVDs
1 × $31.00 -
×
 Butterfly and Condor Workshop with Aeromir
1 × $15.00
Butterfly and Condor Workshop with Aeromir
1 × $15.00 -
×
 ICT Prodigy Trading Course – $650K in Payouts with Alex Solignani
1 × $15.00
ICT Prodigy Trading Course – $650K in Payouts with Alex Solignani
1 × $15.00 -
×
 Using Intermarket Analysis to Make Smarter Traders with Murray Ruggiero
1 × $4.00
Using Intermarket Analysis to Make Smarter Traders with Murray Ruggiero
1 × $4.00 -
×
 TrendFund.com – 11 DVDs
1 × $69.00
TrendFund.com – 11 DVDs
1 × $69.00 -
×
 Trend Trading Course
1 × $15.00
Trend Trading Course
1 × $15.00 -
×
 Algo Trading Masterclass with Ali Casey - StatOasis
1 × $23.00
Algo Trading Masterclass with Ali Casey - StatOasis
1 × $23.00 -
×
 Forecast 2024 Clarification with Larry Williams
1 × $15.00
Forecast 2024 Clarification with Larry Williams
1 × $15.00 -
×
 0 DTE Options Trading Workshop with Aeromir Corporation
1 × $15.00
0 DTE Options Trading Workshop with Aeromir Corporation
1 × $15.00 -
×
 Quantamentals - The Next Great Forefront Of Trading and Investing with Trading Markets
1 × $8.00
Quantamentals - The Next Great Forefront Of Trading and Investing with Trading Markets
1 × $8.00 -
×
 Options Trading & Ultimate MasterClass With Tyrone Abela - FX Evolution
1 × $54.00
Options Trading & Ultimate MasterClass With Tyrone Abela - FX Evolution
1 × $54.00 -
×
 Ultimate Guide Technical Trading
1 × $23.00
Ultimate Guide Technical Trading
1 × $23.00 -
×
 Order flow self-study training program with iMFtracker
1 × $10.00
Order flow self-study training program with iMFtracker
1 × $10.00 -
×
 Wifxa - INSTITUTIONAL SCALPING
1 × $23.00
Wifxa - INSTITUTIONAL SCALPING
1 × $23.00 -
×
 Matrix Spread Options Trading Course with Base Camp Trading
1 × $31.00
Matrix Spread Options Trading Course with Base Camp Trading
1 × $31.00 -
×
 Intermediate Guide To How Simpler Options Uses ThinkorSwim with Henry Gambell
1 × $15.00
Intermediate Guide To How Simpler Options Uses ThinkorSwim with Henry Gambell
1 × $15.00 -
×
 Tristan Edwards: "How To Set Up A Hedge Fund"
1 × $6.00
Tristan Edwards: "How To Set Up A Hedge Fund"
1 × $6.00 -
×
 The Stock Market Mastery Program with Ryan Hildreth
1 × $12.00
The Stock Market Mastery Program with Ryan Hildreth
1 × $12.00 -
×
 The Ultimate Trading Solution
1 × $15.00
The Ultimate Trading Solution
1 × $15.00 -
×
 The Folio Management Phenomenon with Gene Walden
1 × $6.00
The Folio Management Phenomenon with Gene Walden
1 × $6.00 -
×
 ADVANCED Swing Trading Strategy - Forex Trading Stock Trading
1 × $15.00
ADVANCED Swing Trading Strategy - Forex Trading Stock Trading
1 × $15.00 -
×
 Winter 2016 Ignite Trading Conference (2016)
1 × $23.00
Winter 2016 Ignite Trading Conference (2016)
1 × $23.00 -
×
 The Smart Income Strategy with Anthony Verner
1 × $171.00
The Smart Income Strategy with Anthony Verner
1 × $171.00 -
×
 Ultimate Breakout
1 × $54.00
Ultimate Breakout
1 × $54.00 -
×
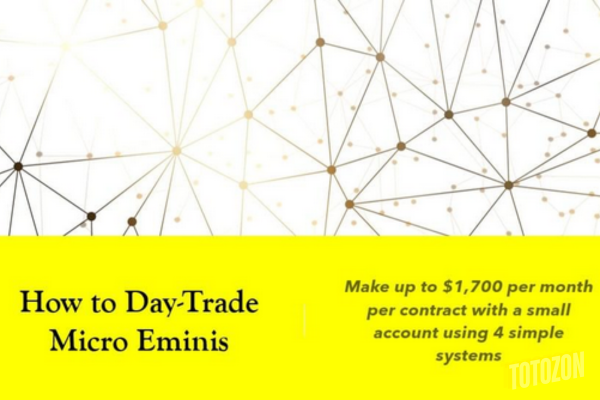 How to Day Trade Micro Eminis with Dr Stoxx
1 × $5.00
How to Day Trade Micro Eminis with Dr Stoxx
1 × $5.00 -
×
 $20 – 52k 20 pips a day challange with Rafał Zuchowicz - TopMasterTrader
1 × $5.00
$20 – 52k 20 pips a day challange with Rafał Zuchowicz - TopMasterTrader
1 × $5.00 -
×
 The In-N-Out Butterfly
1 × $6.00
The In-N-Out Butterfly
1 × $6.00 -
×
 TTM Directional Day Filter System for TS
1 × $6.00
TTM Directional Day Filter System for TS
1 × $6.00

9-Pack of TOS Indicators
$6.00
File Size: Coming soon!
Delivery Time: 1–12 hours
Media Type: Online Course
You may check content proof of “9-Pack of TOS Indicators” below:
Introduction
For traders using the ThinkOrSwim (TOS) platform, having the right set of indicators can make a significant difference in their trading success. The 9-Pack of TOS Indicators is a comprehensive collection designed to enhance your trading strategy by providing valuable insights into market conditions. This article will delve into each indicator, its benefits, and how to effectively use them in your trading.
Understanding the 9-Pack of TOS Indicators
What is the 9-Pack of TOS Indicators?
Definition
- Concept: The 9-Pack of TOS Indicators is a curated set of technical indicators available on the ThinkOrSwim platform, designed to provide diverse market insights.
- Purpose: These indicators help traders analyze price movements, trends, and potential trading opportunities.
Components of the 9-Pack
Overview
- Diverse Tools: The pack includes a mix of trend, momentum, volatility, and volume indicators.
- Customization: Each indicator can be customized to fit individual trading styles and strategies.
The Indicators Explained
1. Moving Average Convergence Divergence (MACD)
Function
- Trend and Momentum: MACD helps identify trend direction and momentum strength.
- Signals: Provides buy and sell signals based on crossovers and divergences.
Usage Tips
- Crossover Strategy: Use MACD line crossovers to identify potential entry and exit points.
- Divergence Analysis: Look for divergences between MACD and price to anticipate reversals.
2. Relative Strength Index (RSI)
Function
- Momentum Indicator: RSI measures the speed and change of price movements.
- Overbought/Oversold Conditions: Identifies potential overbought or oversold conditions in the market.
Usage Tips
- Thresholds: Use the 70/30 levels to identify overbought and oversold conditions.
- Divergence: Look for RSI divergences to predict potential reversals.
3. Bollinger Bands
Function
- Volatility Measurement: Bollinger Bands measure market volatility and identify overbought or oversold levels.
- Price Envelopes: Consist of a middle band (SMA) and two outer bands (standard deviations from the SMA).
Usage Tips
- Band Squeezes: Identify periods of low volatility that may precede significant price movements.
- Price Reversals: Look for price touching or breaking the outer bands to anticipate reversals.
4. Volume Profile
Function
- Volume Distribution: Volume Profile displays trading activity at different price levels.
- Support and Resistance: Helps identify key support and resistance levels based on volume concentration.
Usage Tips
- High Volume Nodes: Use high volume nodes to identify strong support and resistance levels.
- Volume Gaps: Look for gaps in volume to anticipate potential price movements.
5. Average True Range (ATR)
Function
- Volatility Indicator: ATR measures market volatility by calculating the average range of price movements over a period.
- Risk Management: Helps in setting stop-loss levels based on volatility.
Usage Tips
- Stop-Loss Levels: Use ATR to set appropriate stop-loss levels.
- Volatility Analysis: Compare ATR values to assess market volatility trends.
6. Fibonacci Retracement
Function
- Support and Resistance: Fibonacci retracement levels indicate potential support and resistance areas.
- Price Targets: Helps in setting price targets based on retracement levels.
Usage Tips
- Retracement Levels: Use common retracement levels (38.2%, 50%, 61.8%) to identify potential reversal points.
- Combination with Other Indicators: Combine with other indicators for stronger signals.
7. Stochastic Oscillator
Function
- Momentum Indicator: The Stochastic Oscillator compares a specific closing price to a range of prices over a certain period.
- Overbought/Oversold Conditions: Identifies overbought and oversold conditions.
Usage Tips
- %K and %D Crossovers: Use crossovers between the %K and %D lines to identify buy and sell signals.
- Divergence: Look for divergences between the Stochastic Oscillator and price to anticipate reversals.
8. On-Balance Volume (OBV)
Function
- Volume Indicator: OBV measures buying and selling pressure by accumulating volume based on price movement direction.
- Trend Confirmation: Confirms price trends based on volume flow.
Usage Tips
- Trend Analysis: Use OBV to confirm existing price trends.
- Divergence: Look for divergences between OBV and price to anticipate potential reversals.
9. Parabolic SAR
Function
- Trend Indicator: Parabolic SAR helps identify potential trend reversals and provides stop-loss levels.
- Trailing Stop: Acts as a trailing stop-loss indicator.
Usage Tips
- Trailing Stops: Use Parabolic SAR to set trailing stop-loss levels.
- Reversal Signals: Pay attention to the indicator’s position relative to price for reversal signals.
How to Implement the 9-Pack of TOS Indicators
Setting Up on ThinkOrSwim
Installation
- Platform Access: Ensure you have access to the ThinkOrSwim platform.
- Customization: Add the indicators to your chart and customize their settings to match your trading strategy.
Combining Indicators
Synergy
- Multiple Signals: Use multiple indicators to confirm trading signals.
- Diverse Perspectives: Gain a comprehensive view of market conditions by combining different types of indicators.
Developing a Trading Strategy
Step-by-Step Guide
- Identify Trends: Use trend indicators like MACD and Parabolic SAR to identify the market trend.
- Confirm Momentum: Confirm the trend with momentum indicators like RSI and Stochastic Oscillator.
- Set Entry and Exit Points: Use Bollinger Bands and Fibonacci Retracement to set entry and exit points.
- Manage Risk: Use ATR for setting stop-loss levels and Volume Profile for identifying key support and resistance levels.
Conclusion
The 9-Pack of TOS Indicators provides a comprehensive toolkit for traders looking to enhance their trading strategies. By understanding and effectively utilizing each indicator, traders can gain valuable insights into market conditions, identify trading opportunities, and manage risks more effectively. Whether you are a beginner or an experienced trader, integrating these indicators into your trading routine can significantly improve your trading outcomes.
Frequently Asked Questions:
- Business Model Innovation:
Embrace our legitimate business model! We organize group buys, allowing participants to share costs for popular courses, making them accessible to those with limited financial resources. Our approach ensures affordability and accessibility, despite author concerns. - The Legal Environment:
The legality of our activity is uncertain. While we lack specific permission from course authors, there’s a technicality: authors didn’t impose resale limits upon course purchase. This presents both an opportunity for us and a benefit for individuals seeking low-cost access. - Quality Control:
Unveiling the Truth
Quality is paramount. Purchasing courses directly from sales pages ensures consistency with traditionally obtained materials. However, we’re not official course providers and don’t offer premium services:
- No scheduled coaching calls or sessions with the author.
- No access to the author’s private Facebook group or web portal.
- No entry to the author’s private membership forum.
- Direct email support from the author or their team is unavailable.Operating independently, we aim to bridge the pricing gap without additional services provided by official channels. Your understanding of our unique approach is valued.
Be the first to review “9-Pack of TOS Indicators”
You must be logged in to post a review.
Related products
Original price was: $197.00.$5.00Current price is: $5.00.
Original price was: $450.00.$23.00Current price is: $23.00.

Original price was: $310.00.$23.00Current price is: $23.00.

Original price was: $1,200.00.$23.00Current price is: $23.00.
Forex Trading
Original price was: $697.00.$5.00Current price is: $5.00.

Forex Trading
Original price was: $1,098.00.$39.00Current price is: $39.00.

Forex Trading
Original price was: $550.00.$5.00Current price is: $5.00.
Forex Trading
Original price was: $249.00.$15.00Current price is: $15.00.
Original price was: $2,120.00.$15.00Current price is: $15.00.
Forex Trading
The Complete Guide to Multiple Time Frame Analysis & Reading Price Action with Aiman Almansoori
Original price was: $1,399.00.$13.00Current price is: $13.00.

Original price was: $497.00.$11.00Current price is: $11.00.

Original price was: $997.00.$13.00Current price is: $13.00.

Original price was: $895.00.$15.00Current price is: $15.00.
Original price was: $1,800.00.$54.00Current price is: $54.00.
Original price was: $497.00.$31.00Current price is: $31.00.
Forex Trading
Original price was: $1,898.00.$10.00Current price is: $10.00.
Original price was: $799.00.$15.00Current price is: $15.00.
Forex Trading
Original price was: $500.00.$5.00Current price is: $5.00.
Original price was: $4,995.00.$15.00Current price is: $15.00.

Forex Trading
Original price was: $239.00.$8.00Current price is: $8.00.
Reviews
There are no reviews yet.