-
×
 Sector Trading Strategies: Turning Steady Profits Even in Stubborn Markets By Deron Wagner & John Boyer
1 × $6.00
Sector Trading Strategies: Turning Steady Profits Even in Stubborn Markets By Deron Wagner & John Boyer
1 × $6.00 -
×
 The Trap Trade Workshop with Doc Severson
1 × $6.00
The Trap Trade Workshop with Doc Severson
1 × $6.00 -
×
 Trading Techniques 2008 - One Day Workshop Manual
1 × $6.00
Trading Techniques 2008 - One Day Workshop Manual
1 × $6.00 -
×
 ICT Prodigy Trading Course – $650K in Payouts with Alex Solignani
1 × $15.00
ICT Prodigy Trading Course – $650K in Payouts with Alex Solignani
1 × $15.00 -
×
 Top Futures Day Trading Course DVD
1 × $6.00
Top Futures Day Trading Course DVD
1 × $6.00 -
×
 MACD Divergence Semi-Automatic Scanner For Tradestation with Elder
1 × $31.00
MACD Divergence Semi-Automatic Scanner For Tradestation with Elder
1 × $31.00 -
×
 Technical Analysis for the Trading Professional with Constance Brown
1 × $6.00
Technical Analysis for the Trading Professional with Constance Brown
1 × $6.00 -
×
 Evolution Markets FX – TPOT 2.0
1 × $5.00
Evolution Markets FX – TPOT 2.0
1 × $5.00 -
×
 Forex Scalping Strategy Course with Vic Noble & Sarid Harper
1 × $6.00
Forex Scalping Strategy Course with Vic Noble & Sarid Harper
1 × $6.00 -
×
 Fibonacci Swing Trader 2.0 with Frank Paul - Forexmentor
1 × $6.00
Fibonacci Swing Trader 2.0 with Frank Paul - Forexmentor
1 × $6.00 -
×
 Forecast 2024 Clarification with Larry Williams
1 × $15.00
Forecast 2024 Clarification with Larry Williams
1 × $15.00 -
×
 The Point of Control and Imbalance Course with Mike Valtos - Orderflows
1 × $15.00
The Point of Control and Imbalance Course with Mike Valtos - Orderflows
1 × $15.00 -
×
 RiskIllustrator By Charles Cottle - The Risk Doctor
1 × $31.00
RiskIllustrator By Charles Cottle - The Risk Doctor
1 × $31.00 -
×
 The Orderflows Trade Opportunities Encyclopedia with Michael Valtos
1 × $8.00
The Orderflows Trade Opportunities Encyclopedia with Michael Valtos
1 × $8.00 -
×
 Interactive Course
1 × $6.00
Interactive Course
1 × $6.00 -
×
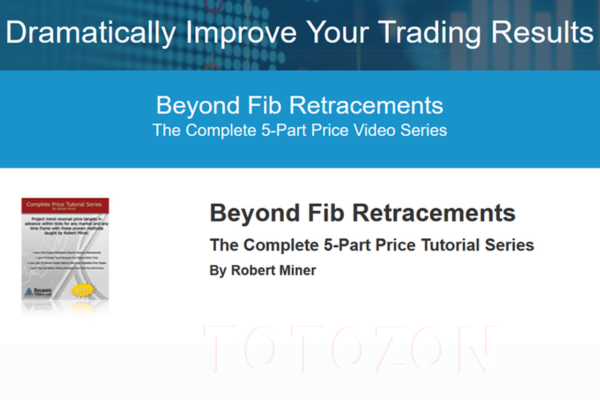 Beyond Fibonacci Retracements with Dynamic Traders
1 × $5.00
Beyond Fibonacci Retracements with Dynamic Traders
1 × $5.00 -
×
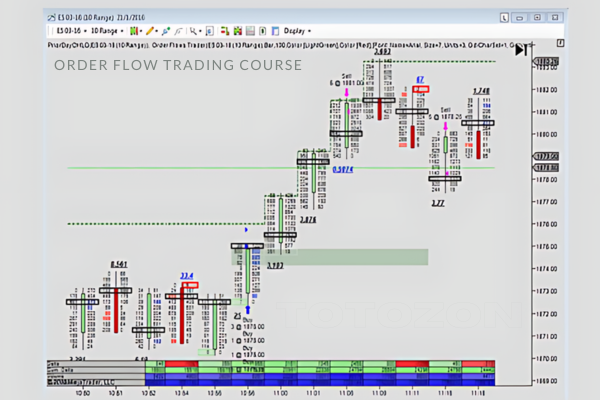 Order Flow Trading Course with Orderflows
1 × $23.00
Order Flow Trading Course with Orderflows
1 × $23.00 -
×
 $20 – 52k 20 pips a day challange with Rafał Zuchowicz - TopMasterTrader
1 × $5.00
$20 – 52k 20 pips a day challange with Rafał Zuchowicz - TopMasterTrader
1 × $5.00 -
×
 The Newsbeat Bandit Program with Mark Melnick - T3 Live
1 × $6.00
The Newsbeat Bandit Program with Mark Melnick - T3 Live
1 × $6.00 -
×
 CFA Level 1 – PassMaster 2004 CD with Stalla
1 × $6.00
CFA Level 1 – PassMaster 2004 CD with Stalla
1 × $6.00 -
×
 STREAM ALERTS
1 × $6.00
STREAM ALERTS
1 × $6.00 -
×
 Quantamentals - The Next Great Forefront Of Trading and Investing with Trading Markets
1 × $8.00
Quantamentals - The Next Great Forefront Of Trading and Investing with Trading Markets
1 × $8.00 -
×
 Bradley F.Cowan (Cycle-Trader.com)
1 × $23.00
Bradley F.Cowan (Cycle-Trader.com)
1 × $23.00 -
×
 Complete 32+ Hour Video Training Course 2008
1 × $23.00
Complete 32+ Hour Video Training Course 2008
1 × $23.00 -
×
 The MMXM Trader – Personal Approach
1 × $5.00
The MMXM Trader – Personal Approach
1 × $5.00 -
×
 Forex Profit Multiplier with Bill & Greg Poulos
1 × $6.00
Forex Profit Multiplier with Bill & Greg Poulos
1 × $6.00 -
×
 The Trading Blueprint with Brad Goh - The Trading Geek
1 × $5.00
The Trading Blueprint with Brad Goh - The Trading Geek
1 × $5.00 -
×
 The A14 Weekly Option Strategy Workshop with Amy Meissner
1 × $23.00
The A14 Weekly Option Strategy Workshop with Amy Meissner
1 × $23.00 -
×
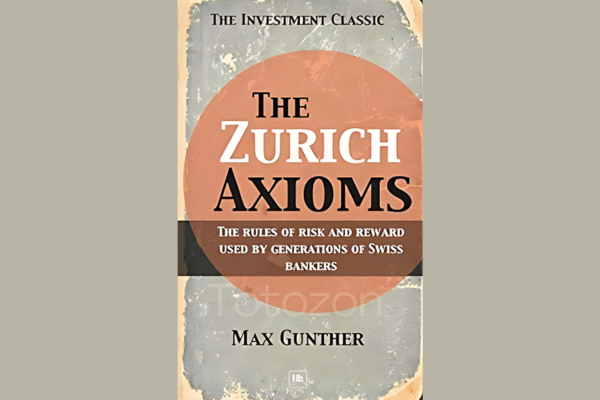 The Zurich Axioms with Max Gunther
1 × $6.00
The Zurich Axioms with Max Gunther
1 × $6.00 -
×
 Online Forex University Course
1 × $10.00
Online Forex University Course
1 × $10.00 -
×
 Professional Development Program (BRONZE Bundle) with Deeyana Angelo
1 × $78.00
Professional Development Program (BRONZE Bundle) with Deeyana Angelo
1 × $78.00 -
×
 Trampoline Trading with Claytrader
1 × $6.00
Trampoline Trading with Claytrader
1 × $6.00 -
×
 Seven Principles of Great Trading (Audio CD) By Van Tharp
1 × $6.00
Seven Principles of Great Trading (Audio CD) By Van Tharp
1 × $6.00 -
×
 High Probability Trading Using Elliott Wave And Fibonacci Analysis withVic Patel - Forex Training Group
1 × $10.00
High Probability Trading Using Elliott Wave And Fibonacci Analysis withVic Patel - Forex Training Group
1 × $10.00 -
×
 Winning With The Market with Douglas R.Sease
1 × $6.00
Winning With The Market with Douglas R.Sease
1 × $6.00 -
×
 The Best of the Professional Traders Journal: Options Trading and Volatility Trading with Larry Connors
1 × $6.00
The Best of the Professional Traders Journal: Options Trading and Volatility Trading with Larry Connors
1 × $6.00 -
×
 Deep Dive Butterfly Trading Strategy Class with SJG Trades
1 × $41.00
Deep Dive Butterfly Trading Strategy Class with SJG Trades
1 × $41.00 -
×
 The Intelligent Investor (Audio Book) with Benjamin Graham
1 × $6.00
The Intelligent Investor (Audio Book) with Benjamin Graham
1 × $6.00 -
×
 Long/Short Market Dynamics: Trading Strategies for Today's Markets with Clive Corcoran
1 × $6.00
Long/Short Market Dynamics: Trading Strategies for Today's Markets with Clive Corcoran
1 × $6.00 -
×
 Volatility Trading with Euan Sinclair
1 × $6.00
Volatility Trading with Euan Sinclair
1 × $6.00 -
×
 High Probability Trading with Marcel Link
1 × $6.00
High Probability Trading with Marcel Link
1 × $6.00 -
×
 Weekly Credit Spreads for Income
1 × $6.00
Weekly Credit Spreads for Income
1 × $6.00 -
×
 Techical Analysis with Charles D.Kirkpatrick
1 × $6.00
Techical Analysis with Charles D.Kirkpatrick
1 × $6.00 -
×
 Crypto Trading Academy with Cheeky Investor - Aussie Day Trader
1 × $13.00
Crypto Trading Academy with Cheeky Investor - Aussie Day Trader
1 × $13.00 -
×
 Inside Strategies for Profiting with Options with Max Ansbacher
1 × $6.00
Inside Strategies for Profiting with Options with Max Ansbacher
1 × $6.00 -
×
 BOSSPack Course with Pat Mitchell – Trick Trades
1 × $69.00
BOSSPack Course with Pat Mitchell – Trick Trades
1 × $69.00 -
×
 Ultimate Trading Course with Dodgy's Dungeon
1 × $8.00
Ultimate Trading Course with Dodgy's Dungeon
1 × $8.00

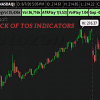
9-Pack of TOS Indicators
$6.00
File Size: Coming soon!
Delivery Time: 1–12 hours
Media Type: Online Course
You may check content proof of “9-Pack of TOS Indicators” below:
Introduction
For traders using the ThinkOrSwim (TOS) platform, having the right set of indicators can make a significant difference in their trading success. The 9-Pack of TOS Indicators is a comprehensive collection designed to enhance your trading strategy by providing valuable insights into market conditions. This article will delve into each indicator, its benefits, and how to effectively use them in your trading.
Understanding the 9-Pack of TOS Indicators
What is the 9-Pack of TOS Indicators?
Definition
- Concept: The 9-Pack of TOS Indicators is a curated set of technical indicators available on the ThinkOrSwim platform, designed to provide diverse market insights.
- Purpose: These indicators help traders analyze price movements, trends, and potential trading opportunities.
Components of the 9-Pack
Overview
- Diverse Tools: The pack includes a mix of trend, momentum, volatility, and volume indicators.
- Customization: Each indicator can be customized to fit individual trading styles and strategies.
The Indicators Explained
1. Moving Average Convergence Divergence (MACD)
Function
- Trend and Momentum: MACD helps identify trend direction and momentum strength.
- Signals: Provides buy and sell signals based on crossovers and divergences.
Usage Tips
- Crossover Strategy: Use MACD line crossovers to identify potential entry and exit points.
- Divergence Analysis: Look for divergences between MACD and price to anticipate reversals.
2. Relative Strength Index (RSI)
Function
- Momentum Indicator: RSI measures the speed and change of price movements.
- Overbought/Oversold Conditions: Identifies potential overbought or oversold conditions in the market.
Usage Tips
- Thresholds: Use the 70/30 levels to identify overbought and oversold conditions.
- Divergence: Look for RSI divergences to predict potential reversals.
3. Bollinger Bands
Function
- Volatility Measurement: Bollinger Bands measure market volatility and identify overbought or oversold levels.
- Price Envelopes: Consist of a middle band (SMA) and two outer bands (standard deviations from the SMA).
Usage Tips
- Band Squeezes: Identify periods of low volatility that may precede significant price movements.
- Price Reversals: Look for price touching or breaking the outer bands to anticipate reversals.
4. Volume Profile
Function
- Volume Distribution: Volume Profile displays trading activity at different price levels.
- Support and Resistance: Helps identify key support and resistance levels based on volume concentration.
Usage Tips
- High Volume Nodes: Use high volume nodes to identify strong support and resistance levels.
- Volume Gaps: Look for gaps in volume to anticipate potential price movements.
5. Average True Range (ATR)
Function
- Volatility Indicator: ATR measures market volatility by calculating the average range of price movements over a period.
- Risk Management: Helps in setting stop-loss levels based on volatility.
Usage Tips
- Stop-Loss Levels: Use ATR to set appropriate stop-loss levels.
- Volatility Analysis: Compare ATR values to assess market volatility trends.
6. Fibonacci Retracement
Function
- Support and Resistance: Fibonacci retracement levels indicate potential support and resistance areas.
- Price Targets: Helps in setting price targets based on retracement levels.
Usage Tips
- Retracement Levels: Use common retracement levels (38.2%, 50%, 61.8%) to identify potential reversal points.
- Combination with Other Indicators: Combine with other indicators for stronger signals.
7. Stochastic Oscillator
Function
- Momentum Indicator: The Stochastic Oscillator compares a specific closing price to a range of prices over a certain period.
- Overbought/Oversold Conditions: Identifies overbought and oversold conditions.
Usage Tips
- %K and %D Crossovers: Use crossovers between the %K and %D lines to identify buy and sell signals.
- Divergence: Look for divergences between the Stochastic Oscillator and price to anticipate reversals.
8. On-Balance Volume (OBV)
Function
- Volume Indicator: OBV measures buying and selling pressure by accumulating volume based on price movement direction.
- Trend Confirmation: Confirms price trends based on volume flow.
Usage Tips
- Trend Analysis: Use OBV to confirm existing price trends.
- Divergence: Look for divergences between OBV and price to anticipate potential reversals.
9. Parabolic SAR
Function
- Trend Indicator: Parabolic SAR helps identify potential trend reversals and provides stop-loss levels.
- Trailing Stop: Acts as a trailing stop-loss indicator.
Usage Tips
- Trailing Stops: Use Parabolic SAR to set trailing stop-loss levels.
- Reversal Signals: Pay attention to the indicator’s position relative to price for reversal signals.
How to Implement the 9-Pack of TOS Indicators
Setting Up on ThinkOrSwim
Installation
- Platform Access: Ensure you have access to the ThinkOrSwim platform.
- Customization: Add the indicators to your chart and customize their settings to match your trading strategy.
Combining Indicators
Synergy
- Multiple Signals: Use multiple indicators to confirm trading signals.
- Diverse Perspectives: Gain a comprehensive view of market conditions by combining different types of indicators.
Developing a Trading Strategy
Step-by-Step Guide
- Identify Trends: Use trend indicators like MACD and Parabolic SAR to identify the market trend.
- Confirm Momentum: Confirm the trend with momentum indicators like RSI and Stochastic Oscillator.
- Set Entry and Exit Points: Use Bollinger Bands and Fibonacci Retracement to set entry and exit points.
- Manage Risk: Use ATR for setting stop-loss levels and Volume Profile for identifying key support and resistance levels.
Conclusion
The 9-Pack of TOS Indicators provides a comprehensive toolkit for traders looking to enhance their trading strategies. By understanding and effectively utilizing each indicator, traders can gain valuable insights into market conditions, identify trading opportunities, and manage risks more effectively. Whether you are a beginner or an experienced trader, integrating these indicators into your trading routine can significantly improve your trading outcomes.
Frequently Asked Questions:
- Business Model Innovation:
Embrace our legitimate business model! We organize group buys, allowing participants to share costs for popular courses, making them accessible to those with limited financial resources. Our approach ensures affordability and accessibility, despite author concerns. - The Legal Environment:
The legality of our activity is uncertain. While we lack specific permission from course authors, there’s a technicality: authors didn’t impose resale limits upon course purchase. This presents both an opportunity for us and a benefit for individuals seeking low-cost access. - Quality Control:
Unveiling the Truth
Quality is paramount. Purchasing courses directly from sales pages ensures consistency with traditionally obtained materials. However, we’re not official course providers and don’t offer premium services:
- No scheduled coaching calls or sessions with the author.
- No access to the author’s private Facebook group or web portal.
- No entry to the author’s private membership forum.
- Direct email support from the author or their team is unavailable.Operating independently, we aim to bridge the pricing gap without additional services provided by official channels. Your understanding of our unique approach is valued.
Be the first to review “9-Pack of TOS Indicators”
You must be logged in to post a review.
Related products

Forex Trading
Original price was: $397.00.$31.00Current price is: $31.00.
Original price was: $310.00.$23.00Current price is: $23.00.
Original price was: $695.00.$41.00Current price is: $41.00.
Forex Trading
Original price was: $797.00.$10.00Current price is: $10.00.

Forex Trading
Original price was: $999.00.$15.00Current price is: $15.00.
Forex Trading
Quantamentals – The Next Great Forefront Of Trading and Investing with Trading Markets
Original price was: $1,495.00.$8.00Current price is: $8.00.

Forex Trading
The Complete Guide to Multiple Time Frame Analysis & Reading Price Action with Aiman Almansoori
Original price was: $1,399.00.$13.00Current price is: $13.00.

Forex Trading
Original price was: $550.00.$5.00Current price is: $5.00.

Forex Trading
Original price was: $2,995.00.$31.00Current price is: $31.00.
Original price was: $197.00.$5.00Current price is: $5.00.

Original price was: $799.00.$15.00Current price is: $15.00.
Original price was: $299.00.$8.00Current price is: $8.00.

Forex Trading
Original price was: $2,000.00.$23.00Current price is: $23.00.
Forex Trading
Original price was: $1,898.00.$10.00Current price is: $10.00.

Forex Trading
Original price was: $4,997.00.$27.00Current price is: $27.00.
Forex Trading
Original price was: $239.00.$8.00Current price is: $8.00.

Original price was: $999.00.$5.00Current price is: $5.00.
Original price was: $2,120.00.$15.00Current price is: $15.00.

Forex Trading
Original price was: $799.00.$15.00Current price is: $15.00.

Original price was: $4,995.00.$15.00Current price is: $15.00.
Reviews
There are no reviews yet.